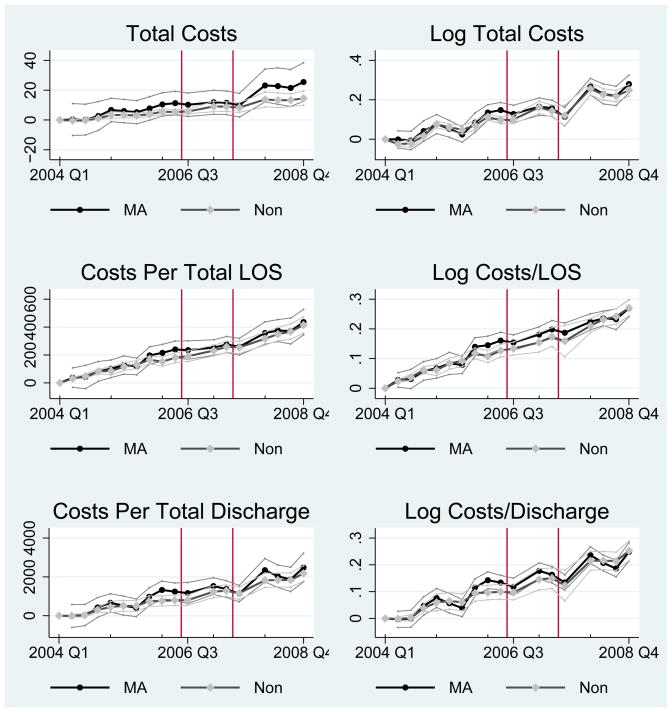
Figure 4.
Trends in MA vs. Non-MA, Hospital Quarter Level
Source: NIS authors’ calculations.
Trends obtained from regressions including hospital fixed effects.
95% asympototic confidence intervals shown.
Confidence intervals clustered by state for Non–MA and robust for MA.
All data omitted in 2006 Q4 and 2007 Q4 because of MA data availability.
Vertical lines separate During and After periods.

