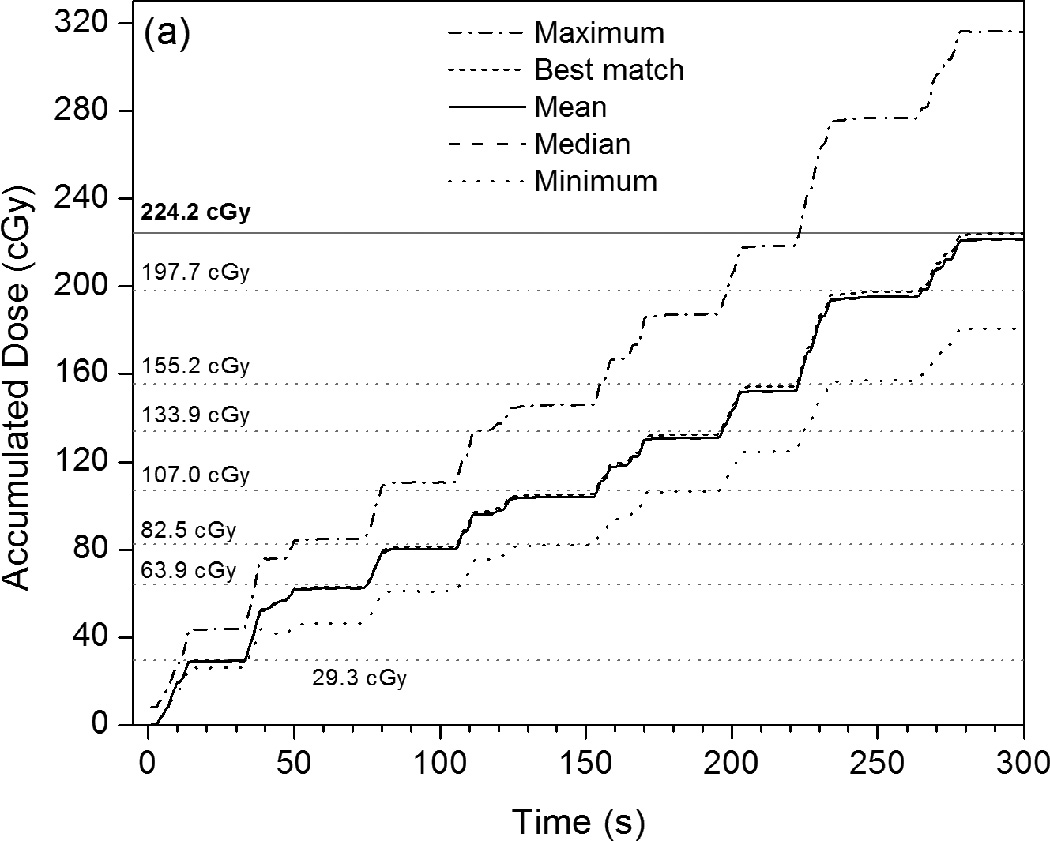
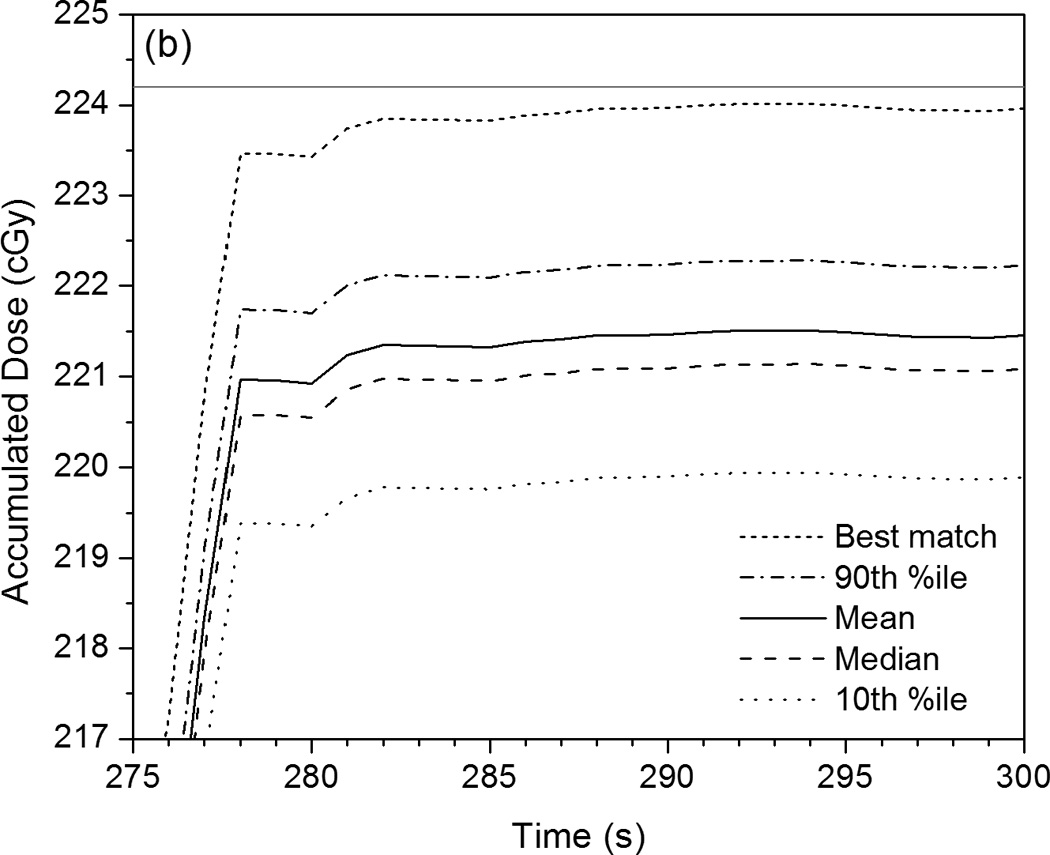
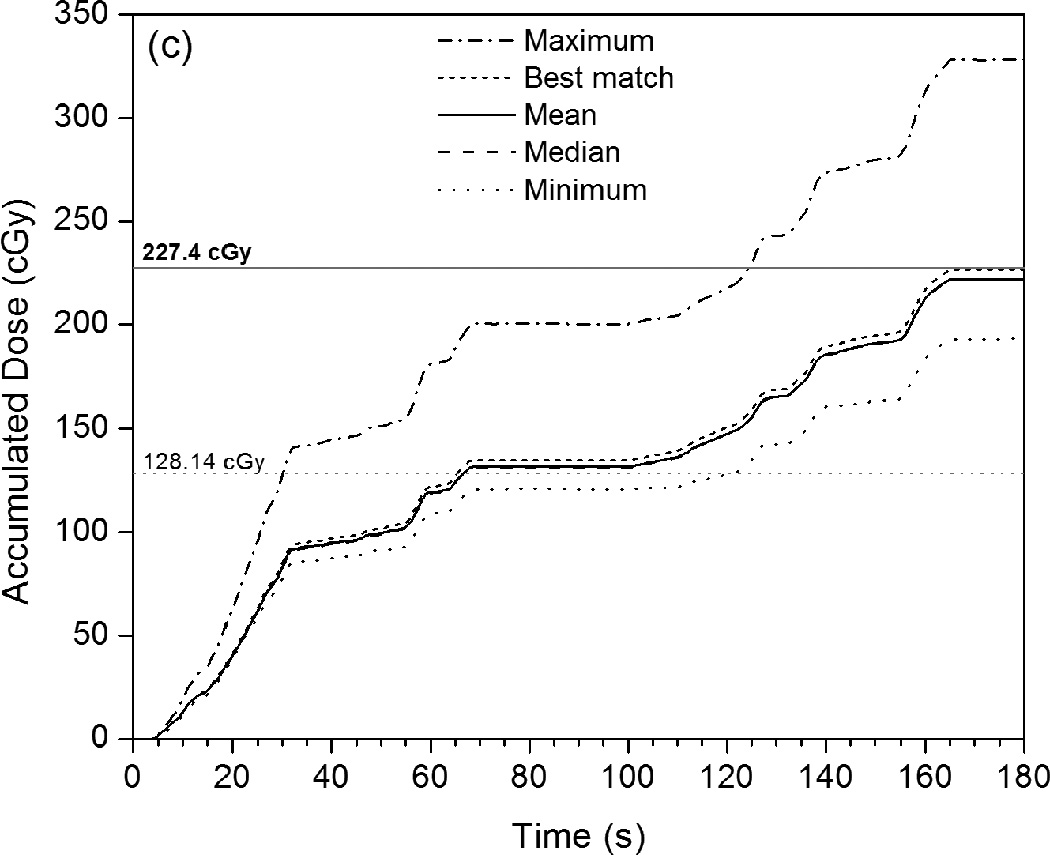
Figure 4.


Plots of accumulated dose versus time as measured by the PSD system with various calibration factors applied. These are compared with the mean dose values measured by the ionization chamber for each intermediate beam or arc (given as horizontal gray dotted lines), as well as the mean total accumulated dose (horizontal gray solid lines). (a) This PSD data, taken under IMRT QA conditions, shows the maximum, mean, median, and minimum calibrated values, as well as the calibrated PSD dose curve that best matches the ionization chamber data. (b) Rescaling of (a) that shows the close proximity of the 10th and 90th percentiles to the mean, median, and best-matched PSD calibration and to the mean total accumulated dose as measured by the ionization chamber. (c) PSD data taken under VMAT QA conditions in identical fashion as that shown in (a).
