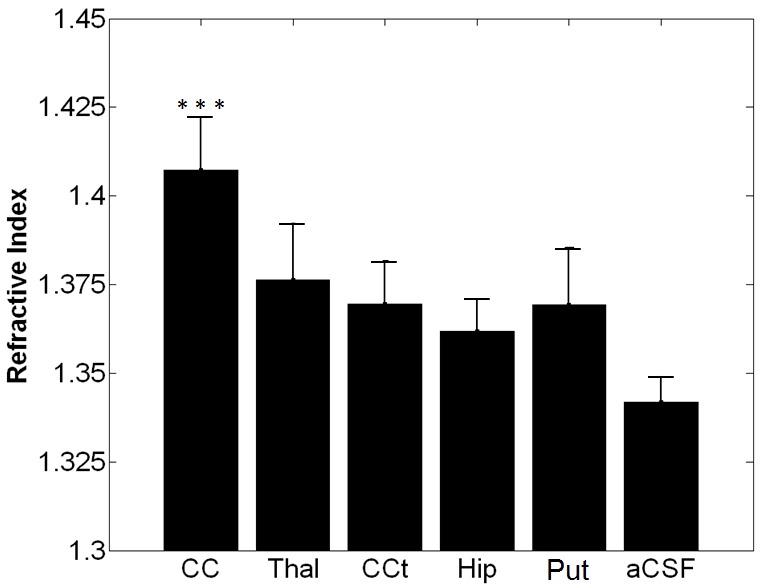
Fig. 6.

Measured RI in various anatomical regions in brain and aCSF. 10 samples were measured at each region. Bars correspond to 1SD (CC = corpus callosum, Thal = thalamus, CCt=cerebral cortex, Hip=hippocampus, Put=putamen, and aCSF=artificial cerebral spinal fluid). RI of corpus callosum was statistically different compared to other regions.
