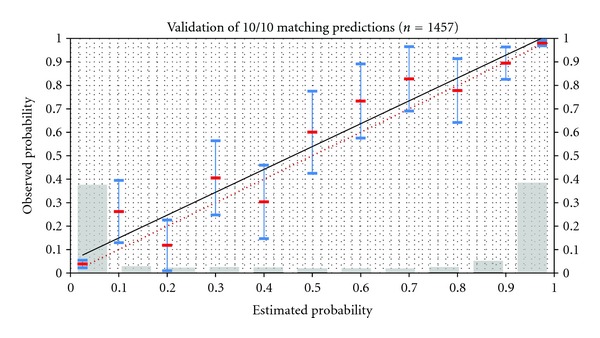
Figure 3.

Prometheus probability matching algorithm (ProMatch): the graph shows the correlation of estimated 10/10 matching probabilities in 10% prediction intervals and corresponding observed probabilities. The population model is approximated by the German population. Blue bars show 95% confidence intervals of estimated probabilities. Grey bars show relative number of CTs in each prediction interval. Red-dotted line is the ideal correlation.
