Figure 3.
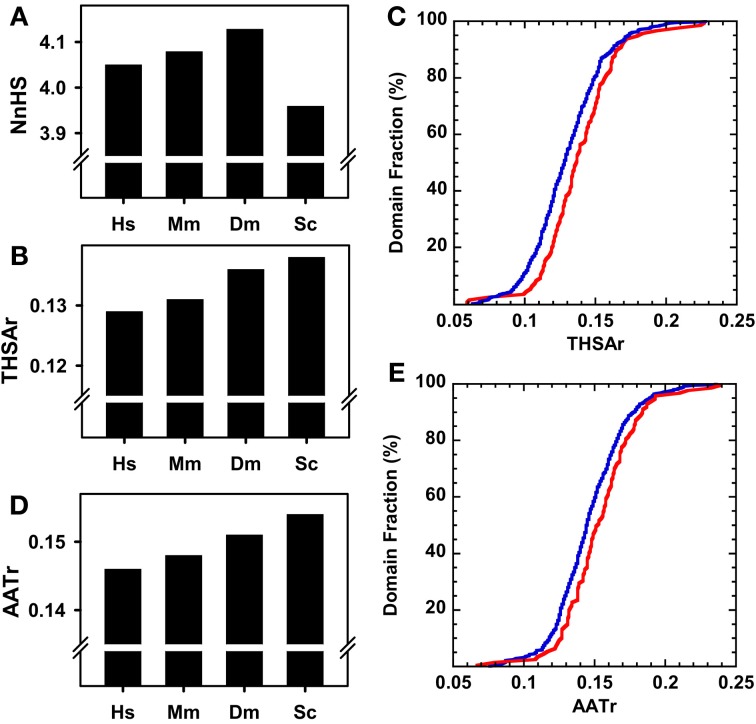
Aggregation properties of complete kinase domain datasets of different organisms. (A) Normalized number of Hot-spots (NnHS). (B) Total Hot-spot area per residue (THSAr). (C) Distribution of the THSAr value along the whole dataset. (D) Area of the aggregation profile above the Hot-Spot Threshold per Residue (AATr). (E) Distribution of the AATr value over the complete kinase domain dataset. In (A), (B), and (D): human (Hs), mouse (Mm), fruit fly (Dm), and budding yeast (Sc). In (C) and (E): the blue line corresponds to the human dataset and the red line to the yeast kinome.

