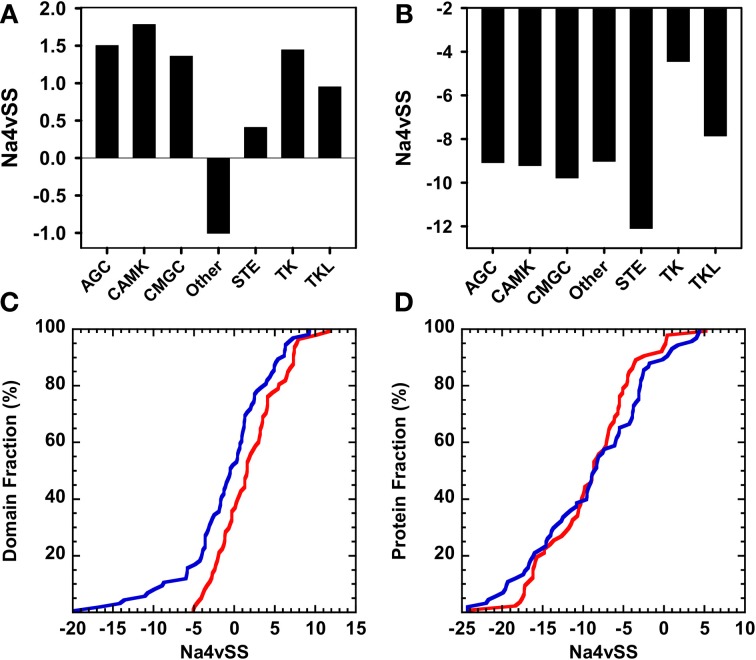
Figure 7.
Aggregation properties of the human kinase proteins and domains clustered according to their corresponding group (only groups composed of >40 sequences are considered). (A) and (B) Average aggregation propensity (Na4vSS) of the sets corresponding to each group considering only domains or whole proteins, respectively. (C) and (D) Distribution of the average aggregation propensity (Na4vSS) across the sets corresponding to the domain groups that show the most opposed behavior: Other (blue) and CAMK (red). Distributions are shown for kinase domains only (C) and for whole proteins (D).

