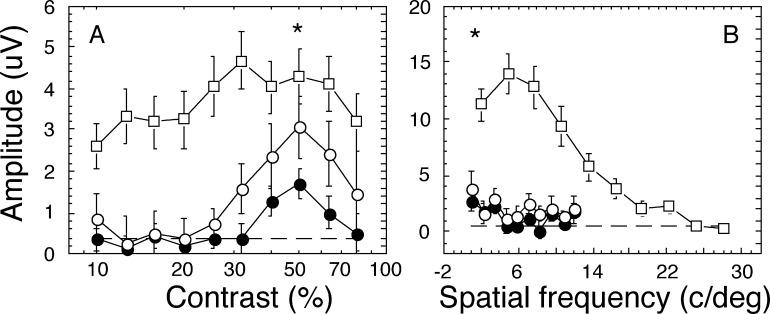
Figure 2. .
Mean response functions for contrast and spatial frequency sVEP at Oz-Cz derivation. Vector-averaged sVEP response amplitudes as a function of swept stimulation parameters in all children with CVI (filled circles, n = 34), CVI with hypoxia only (open circles, n = 14) and age-matched control children (open squares, n = 16) are shown in (A) for contrast stimuli and in (B) for spatial frequency stimuli. Error bars are SEM. Dash lines are noise level. The t-test P values for the peak amplitude differences between all children with CVI (filled circle) and control children (open square) was less than 0.05, and shown as *. The response amplitudes over the entire swept range for both contrast and spatial frequency measures were severely reduced in children with CVI, compared with control children. For those with hypoxia only, their amplitudes were slightly larger than for all children with CVI, but remained the same for spatial frequency stimuli.

