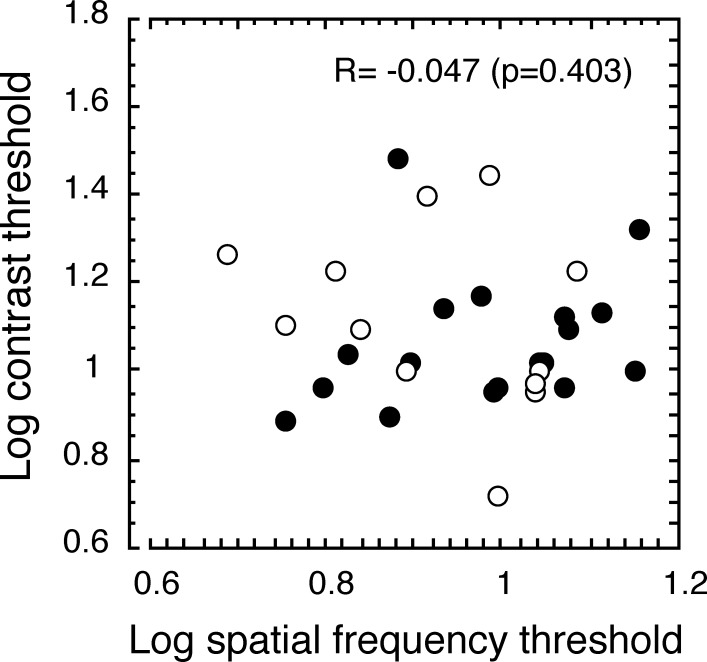
Figure 4. .
Correlation between sVEP contrast thresholds and grating acuities in children with CVI. The filled circles (n = 18) represent children with CVI of mixed etiologies, and the open circles (n = 12) represent children with CVI caused by hypoxia. sVEP contrast thresholds (y-axis) in children with CVI were not correlated with the sVEP grating acuities (x-axis).

