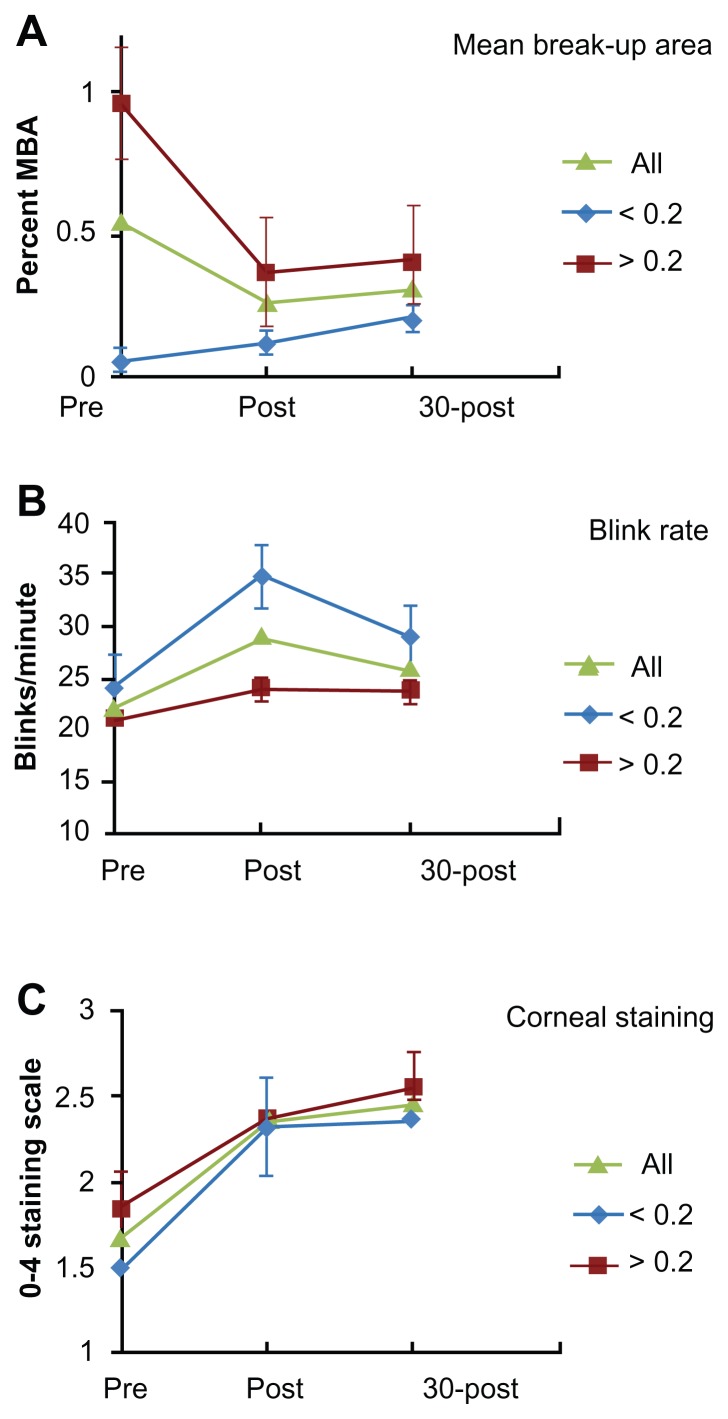
Figure 1.
A Comparison of endpoints before and after CAESM exposure.
Notes: Graphs show mean values (±SD) for the three endpoints in the total population, as well as for subjects with MBAI > 0.2 (severe dry eye), and MBAI < 0.2 (moderate dry eye). (A) Decrease in MBA was limited to subjects with MBAI > 0.2. (B) Compensatory increases in blink rates were primarily seen in subjects with MBAI <0.2. (C) All subjects experienced similar increases in corneal staining.
Abbreviations: CAESM, controlled adverse environment; MBA, mean break-up area; MBAI, initial mean break-up area.

