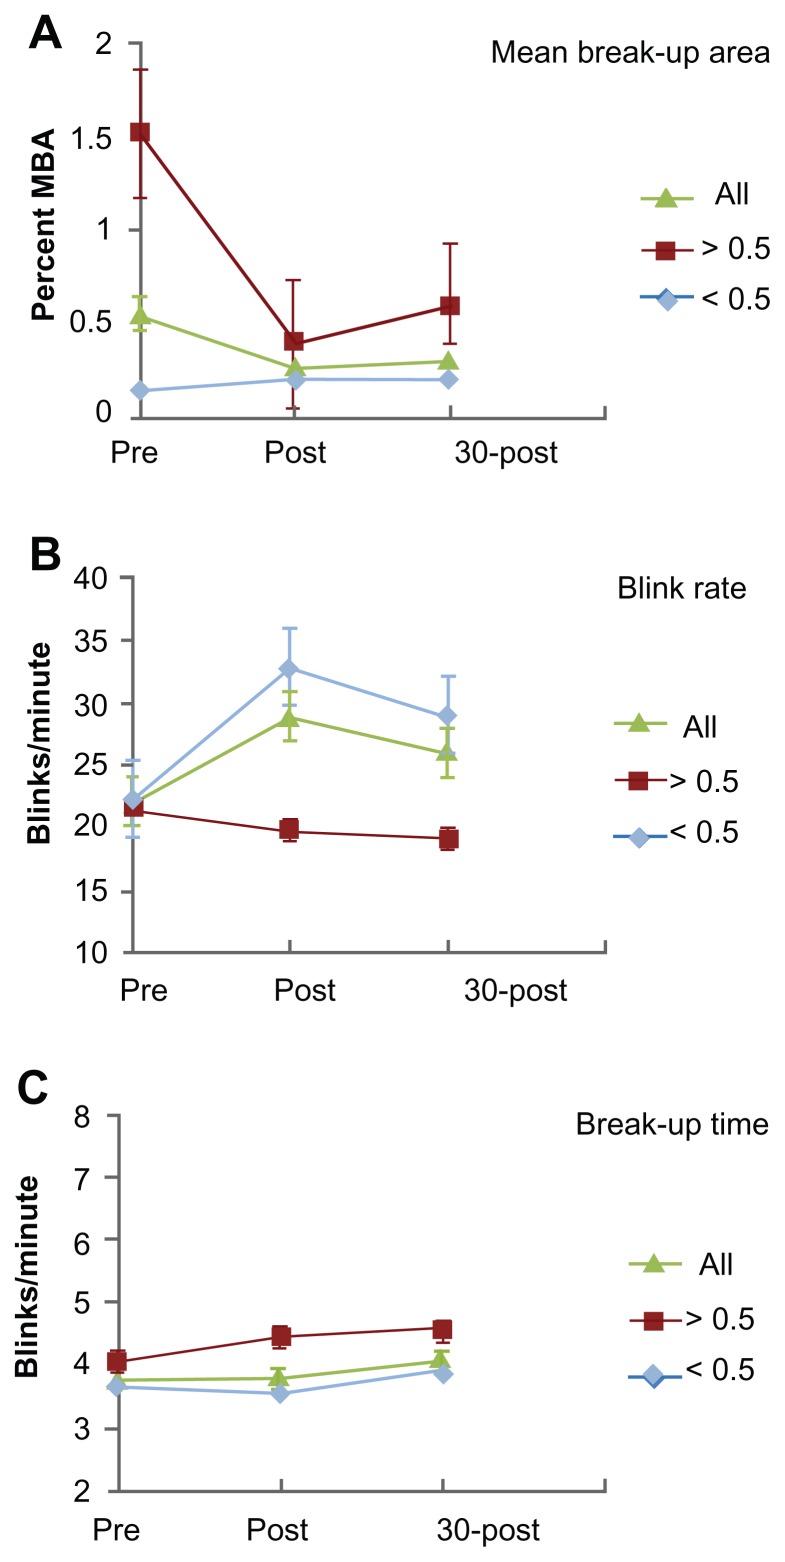
Figure 2.
Subpopulation comparisons.
Notes: Graphs show mean values (±SD) pre, immediately post and 30 min post CAESM for two alternative subpopulations of subjects with MBAI > 0.5 (n = 19) and MBAI < 0.5 (n = 46). (A) and (B) show that the decrease in MBA in the “severe” subpopulation was primarily seen in subjects with the highest MBAI (>0.5) who did not respond to the CAE with increased blink rates (seen in subjects with milder dry eye). Panel (C) shows that forced stare TFBUT was not altered in the total population, nor in these subgroups.
Abbreviations: MBA, mean break-up area; MBAI, initial mean break-up area; CAESM, controlled adverse environment; TFBUT, tear film break-up time.

