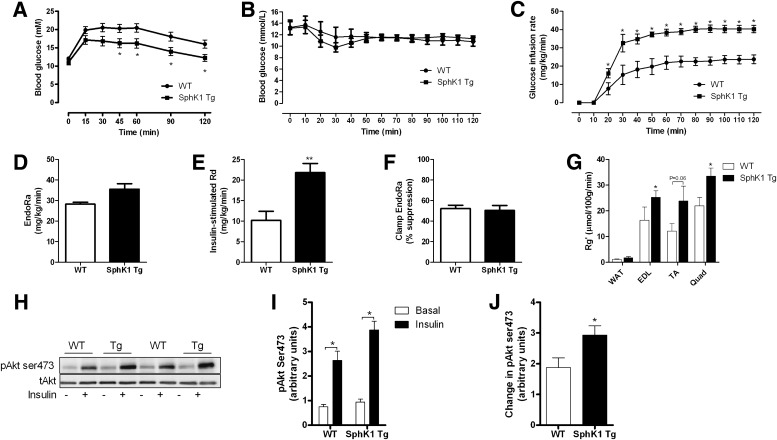
FIG. 3.
Glucose tolerance and insulin sensitivity is enhanced in SphK1 Tg mice fed an HFD. A: Blood glucose levels during a glucose tolerance test in HFD-fed WT (n = 22) and SphK1 Tg (n = 17) mice. B: Blood glucose levels during the hyperinsulinemic, euglycemic clamp (WT n = 5; SphK1 Tg n = 6). C: Glucose infusion rate (WT n = 5; SphK1 Tg n = 6). D: Basal rates of endogenous glucose Ra (EndoRa) (WT n = 5; SphK1 Tg n = 6). E: Insulin-stimulated glucose Rd (WT n = 5; SphK1 Tg n = 6). F: Percent suppression of EndoRa (WT n = 5; SphK1 Tg n = 6). G: Tissue glucose uptake (WT n = 5; SphK1 Tg n = 6). H: Immunoblot of pAkt serine (ser) 473 in basal and insulin-stimulated EDL muscles ex vivo (n = 8 for each group). I: Quantification of pAkt ser473 (n = 8 for each group). J: Fold change in pAkt ser473 under insulin-stimulated conditions. Data are mean ± SEM; n = 17–22 for the glucose tolerance data (n = 8 for each group). *P < 0.05 vs. WT; **P < 0.01 vs. WT. TA, tibialis anterior; Quad, quadriceps.

