FIG. 3.
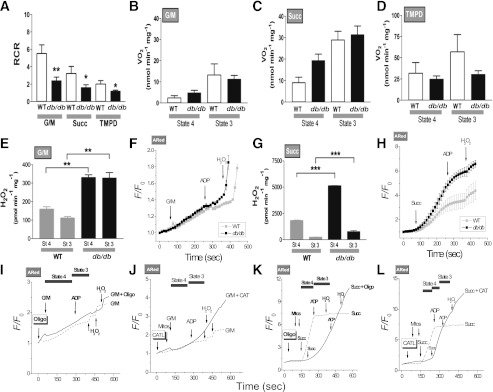
Energetic and redox behavior of WT and db/db mouse mitochondria and blockade of the state 4→3 transition. Respiration in freshly isolated heart mitochondria from WT and db/db mouse was analyzed with a SeaHorse XF96 analyzer as described in research design and methods. A–D: Mitochondria were assayed under state 4, i.e., substrate but no ADP (48) (sometimes also referred to as state 2) (49), and state 3, i.e., substrate and ADP present, respiration (Vo2) with substrates from complex I (5 mmol/L G/M) (B), complex II (5 mmol/L Succ and 1 μmol/L rotenone) (C), and complex IV (0.5 mmol/L N,N,N′,N′-tetramethyl-p-phenylenediamine [TMPD] and 3 mmol/L sodium ascorbate) (D). State 3 was induced with 1 mmol/L ADP in all cases. A: The RCR was determined as the ratio of state 3 to state 4. The bars plotted correspond to n = 8 replicates from two experiments. Respiratory rates determined in the current study belong to the medium to low range of those reported in the literature. Consequently, we further ascertained the quality of our mitochondrial preparation by assaying citrate synthase activity in WT and db/db mitochondrial extracts. The values found compare very well with previous reports (seeSupplementary Data). E–H: H2O2 was monitored with the Amplex Red (ARed) assay. Shown are the results obtained with H2O2-specific fluxes (E and G) or H2O2 emission in state 4 or 3 respiration (F and H) under FET (5 mmol/L G/M) (E and F) and RET (5 mmol/L Succ) (G and H). NADH and ΔΨm were monitored simultaneously with a spectrofluorometer (Supplementary Fig. 2), and O2 measurements were performed in parallel under similar conditions (A–D). Depicted are the normalized ARed traces obtained for WT and db/db mitochondria after G/M (F), Succ (H), and ADP addition, as indicated by arrows. H2O2 (50 nmol/L) was added for calibration purposes. The number of samples analyzed was n = 6 (two experiments) (E and G) and n = 4 (two experiments) (F and H). *P < 0.05; **P < 0.01; ***P < 0.001. Mitochondria from WT mouse heart were resuspended and analyzed under FET (I and J) and RET (K and L) conditions in a spectrofluorometer for H2O2 monitored with ARed or NADH as described in research design and methods. Mitochondria (50–100 μg mitochondrial protein) preincubated with 5 μmol/L oligomycin (Oligo) (I and K) or 10 μmol/L carboxyatractyloside (J and L) are indicated by a continuous line, and control mitochondria in the absence of inhibitors are indicated by a dashed line. Additions of substrate (5 mmol/L G/M or 5 mmol/L Succ), 1 mmol/L ADP, or 50 nmol/L H2O2 (for calibration) are indicated by arrows. Notice that after Oligo or CATL, H2O2 emission continues after ADP (marked) during the transition between states 4→3 of respiration, compared with controls.

