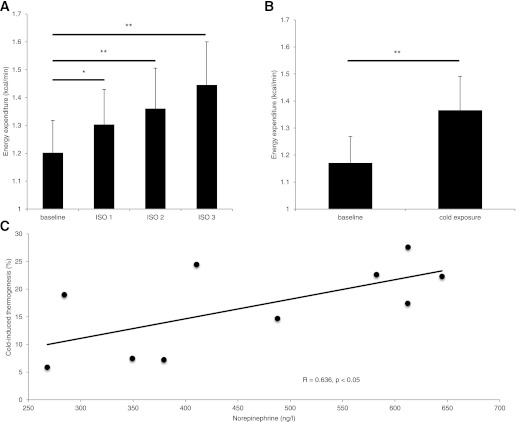
FIG. 1.
ISO- and cold-induced thermogenesis. A: Energy expenditure during baseline and the three ISO doses. B: Energy expenditure during baseline and cold exposure. C: Relationship between the plasma NE level and cold-induced thermogenesis. Values are expressed as means ± SD. *P < 0.05, **P < 0.001, ISO (n = 10) and cold exposure (n = 10).

