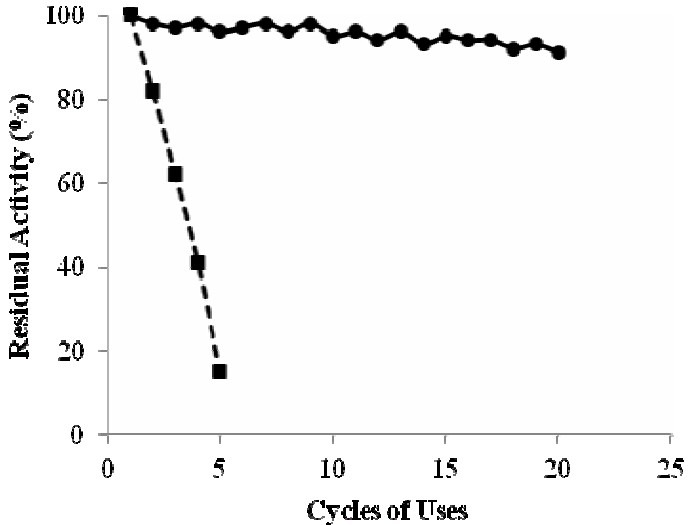
Fig. 6.

Operational stability of E. coli cells permeabilized with CTAB (0.1% w/v) and the cells immobilized using chitosan and glutaraldehyde (5% v/v). Squares (■) data point represent permeabilized cells but un-immobilized, and circles (●) are related to the immobilized cells. Each cycle was conducted at 37°C and pH 7.8 and one day intervals.
