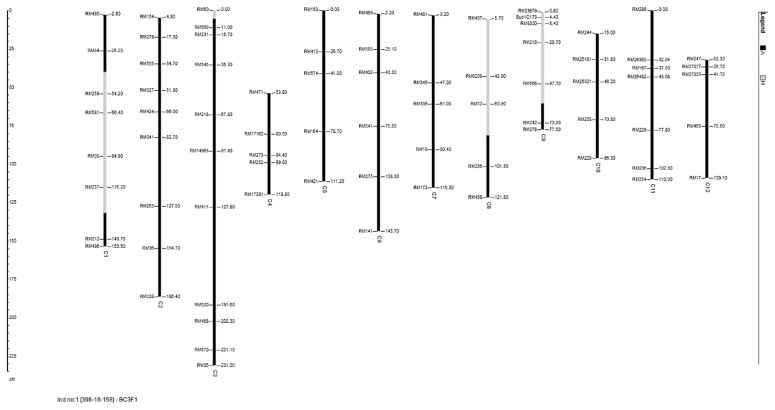
Fig. 2.
Graphical genotype of the plant 396-18-158 of the BC3F1 generation. The black regions on the chromosomes indicates homozygous region for the recipient genome while the gray colored regions indicates the heterozygous regions. The distances were represented in cM based on published map of Temnykh et al. (2001).

