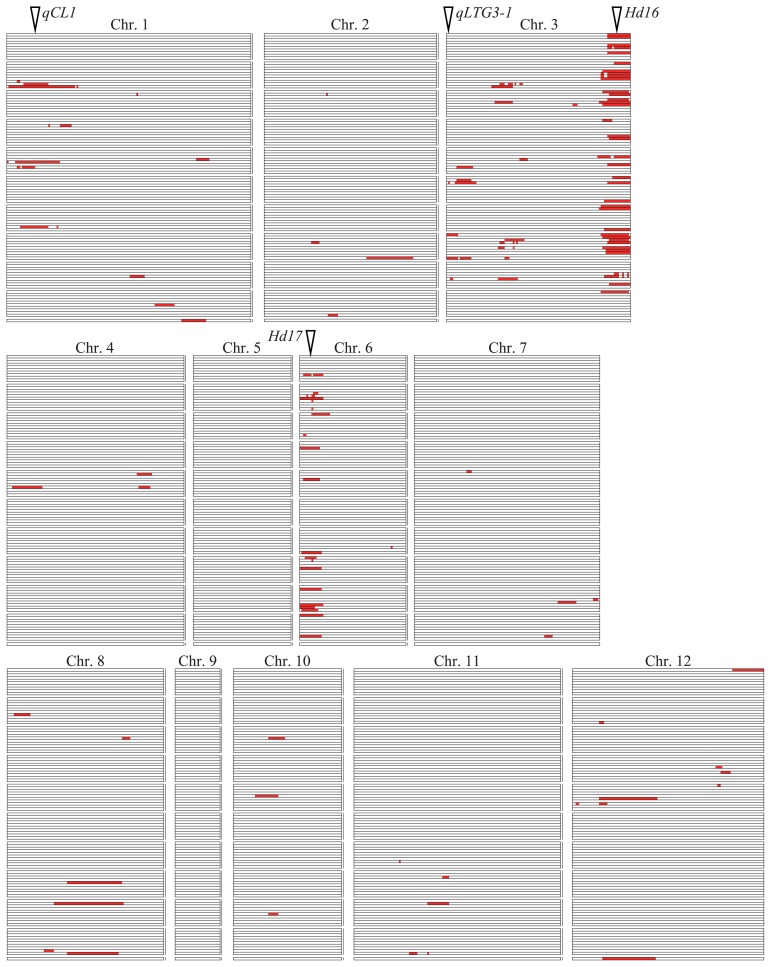
Fig. 2.
Chromosomal locations of 122 QTLs for 38 agronomic traits detected in the Nipponbare/Koshihikari BILs. Marker intervals showing LOD scores exceeding the threshold for significance are indicated by red boxes. Each trait is shown in a vertical row in the same order as in Table 1. The positions of qCL1 (Hori et al. 2009), qLTG3-1 (Fujino et al. 2008b, Hori et al. 2010) and Hd16 and Hd17 (Matsubara et al. 2008) were defined by the positions of flanking markers and are shown here as white triangles.

