Figure 2.

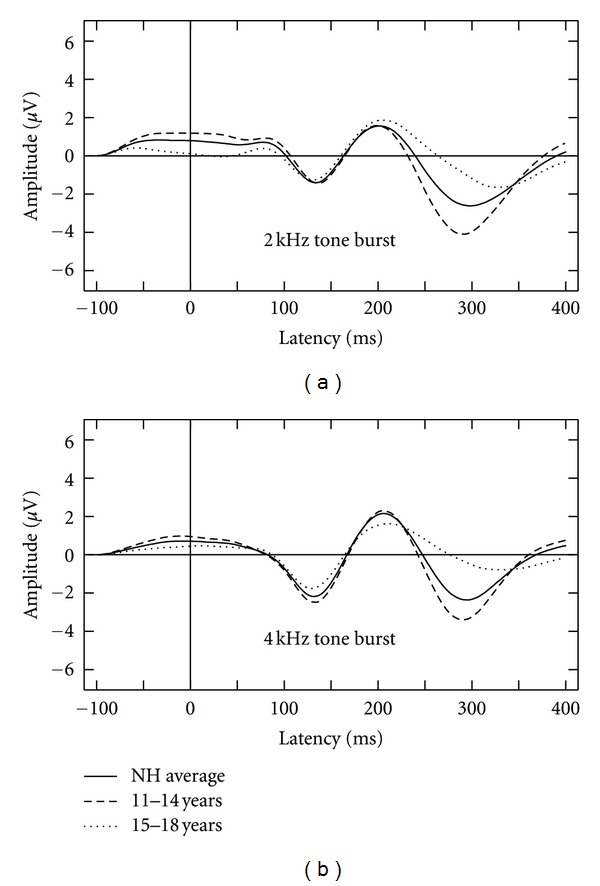
Averaged waveforms displayed according to stimulus for all NH groups including an average of all participants (solid line), those between the ages of 11 to 14 years (dashed line) and those between the ages of 15 to 18 years (dotted line).

Averaged waveforms displayed according to stimulus for all NH groups including an average of all participants (solid line), those between the ages of 11 to 14 years (dashed line) and those between the ages of 15 to 18 years (dotted line).