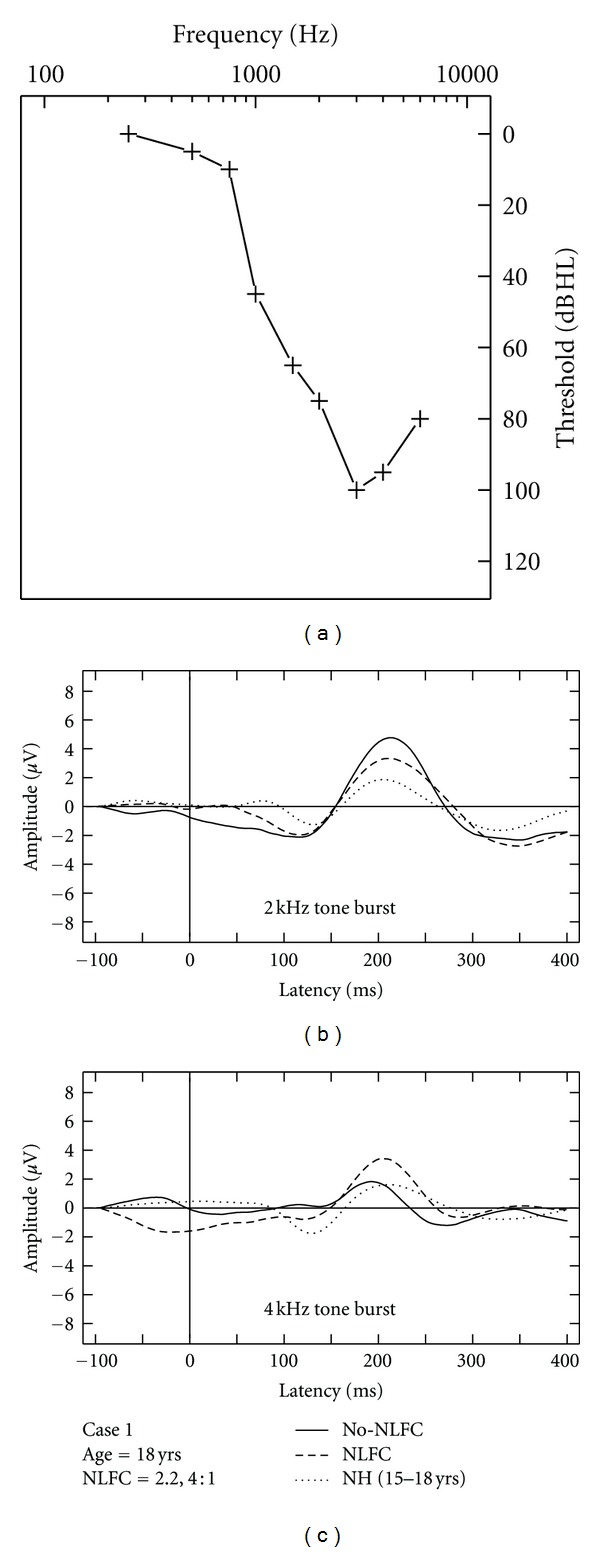
Figure 3.

Case-specific grand mean CAEPs displayed across stimulus types and hearing aid conditions: no-NLFC (solid line), NLFC active (dashed line), and for each participant's age-matched NH group (dotted line). Participant age and prescribed NLFC settings (cut-off frequency, compression ratio) are indicated in the legend. The top left corner pane displays test ear hearing thresholds, suspected cochlear dead regions (DR), and responses beyond the audiometric test range.
