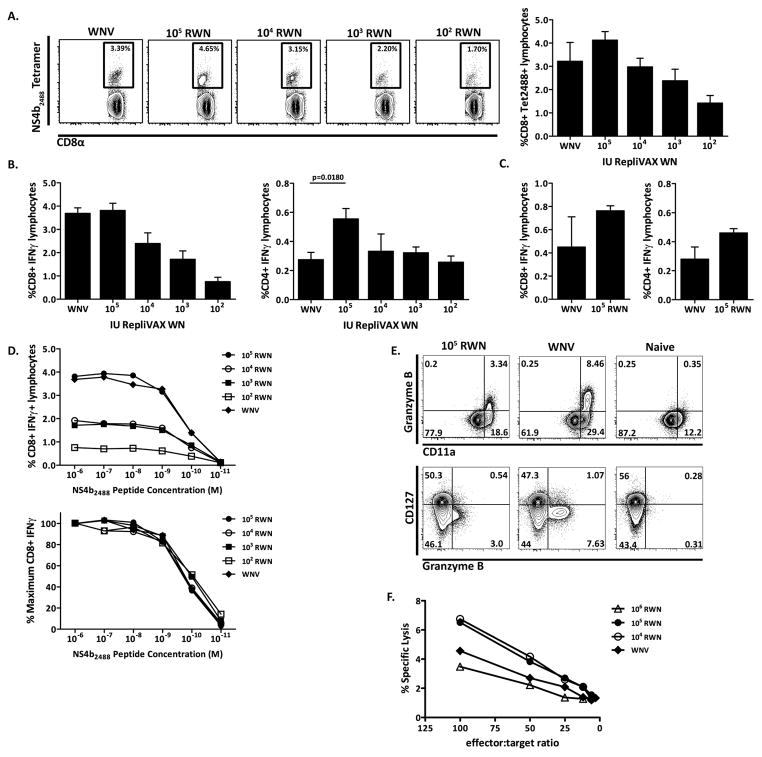
Figure 1. Magnitude and quality of antigen-specific T cells in response to RepliVAX WN vaccination and WNV infection.
A. CD8+ NS4b2488 tetramer+ T cells 7 days post-infection from mice given decreasing doses of RepliVAX WN. Left panel – Example of CD8+ NS4b2488 tetramer+ T cell staining 7 days post-infection, completed by FCM and gated on CD8. Results from a representative mouse at each dose from one out of two similar experiments are shown. Right panel – Quantification of CD8+ NS4b2488 tetramer+ staining showing decreasing doses of RepliVAX WN administered to mice. CD8 tetramer staining was collected by FCM and gated on CD8. N=4 mice per dose, x+/− SEM. One of two experiments. B. Left panel – Quantification of CD8+ T cells from day 7 post-infection by IFNγ ICCS, showing decreasing doses of RepliVAX WN administered to mice. CD8+ T cells were stimulated with 1×10⁻⁶M NS4b2488 peptide for 6 hours in the presence of BFA and analyzed by ICCS. Results depict x+/− SEM from n=4 mice per dose. Right panel – Quantification of CD4+ T cells from day 7 post-infection by IFNγ ICCS, showing decreasing doses of RepliVAX WN administered to mice. CD4+ T cells were stimulated with 1×10⁻⁶M E641 and NS31616+2066 peptide for 6 hours in the presence of BFA and analyzed by ICCS. Results depict x+/− SEM from n=4 mice per dose, from one of two similar experiments. C. Left panel – Quantification of CD8+ T cells from day 45 post-infection by IFNγ ICCS, comparing 105 IU RepliVAX WN to 50pfu of WNV administered to mice. CD8+ T cell ICCS was performed as above. n=4 mice per dose, x+/− SEM. Right panel – Quantification of CD4+ T cells from day 45 post-infection by IFNγ ICCS, comparing 105 IU RepliVAX WN to 50pfu of WNV administered to mice. CD4+ T cell ICCS was performed as above. Results depict x+/− SEM from n=4 mice per dose, from one representative example of two experiments. D. Top panel – Quantification by ICCS of day 7 CD8+ IFNγ+ T cells stimulated with decreasing doses of NS4b2488 peptide. CD8+ T cells stimulated with 1×10⁻⁶ – 1×10⁻¹¹M NS4b2488 peptide for 6 hours in BFA and analyzed by ICCS. Results depict x+/− SEM from n=4 mice per dose of RepliVAX WN. Bottom panel – CD8+ T cell avidity curve with results expressed as a percentage of maximum CD8+ T cell IFNγ production in the presence of saturating peptide concentrations of NS4b2488 (1×10⁻⁶M). Results depict x+/− SEM from n=4 mice per dose of RepliVAX WN. One of two similar experiments is shown. E. Representative example of direct ex-vivo immunophenotyping of day 7 splenocytes, from RepliVAX WN-vaccinated, WNV-infected or naïve mice. Dot plots are gated on CD8. Staining was completed as described in materials and methods. Results shown are from one mouse of four per experiment and from one representative experiment of two. F. Day 7 CD8+ T cell response assayed by direct ex-vivo 6-hour 51Cr-release assay with NS4b peptide coated EL-4 T cells and control cells. n=4 mice in the WNV infected group, 5 mice in all other groups. One representative example of two experiments.

