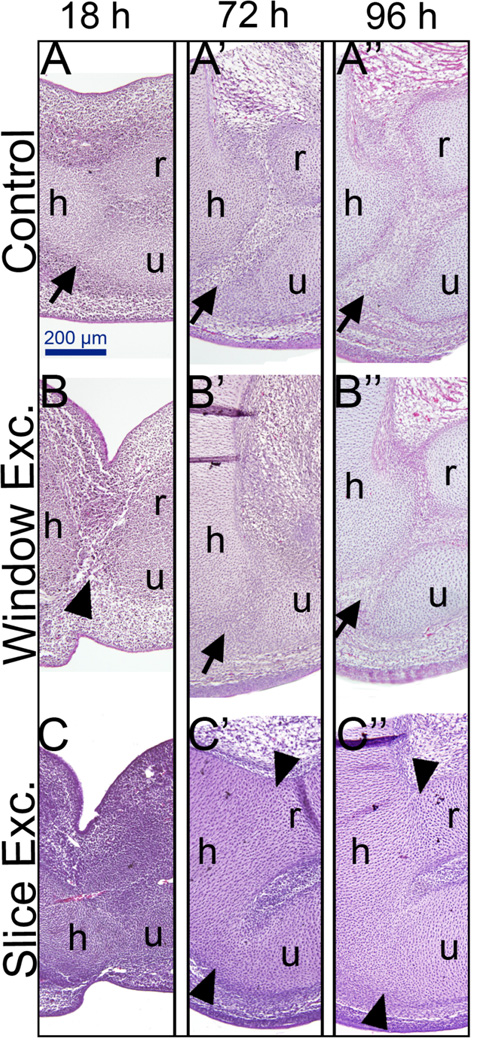
Figure 3.
Histological analysis of joint regeneration. After either WE or SE, limbs were incubated until 18 hours, 72 hours or 96 hours, sectioned and stained with hematoxylin and eosin. A-A”) Controls. 18 hours after surgery corresponds to a 6 day old embryo in the control. By this time, cartilage is differentiating and the interzone can be observed (A, arrow). By 72 hours and 96 hours the control limbs have a developing joint with a distinct interzone (A’ and A”, arrows). B-B”) Window excision (WE). By 18 hours after surgery, the excised area is filled with cells (B, arrowhead). By 72 hours, the regeneration response can already be observed indicated by the presence of a joint interzone (B’, arrow). Note that this interzone does not look as developed as the control (compare A’ to B’). By 96 hours, the regeneration response can be observed by a distinct joint interzone (arrow in B”) comparable to the control (A”). C-C”) Slice Excision (SE). In contrast to WE, SE limbs show fusion of cartilage elements observable at all time points: fusion of the humerus and the ulna is evident at 18 hours. By 72 and 96 hours after surgery, a majority of SE limbs lack an interzone, and they all have completely fused elements (C’ and C”, arrowheads). h: humerus, r: radius, u: ulna, arrows: interzone

