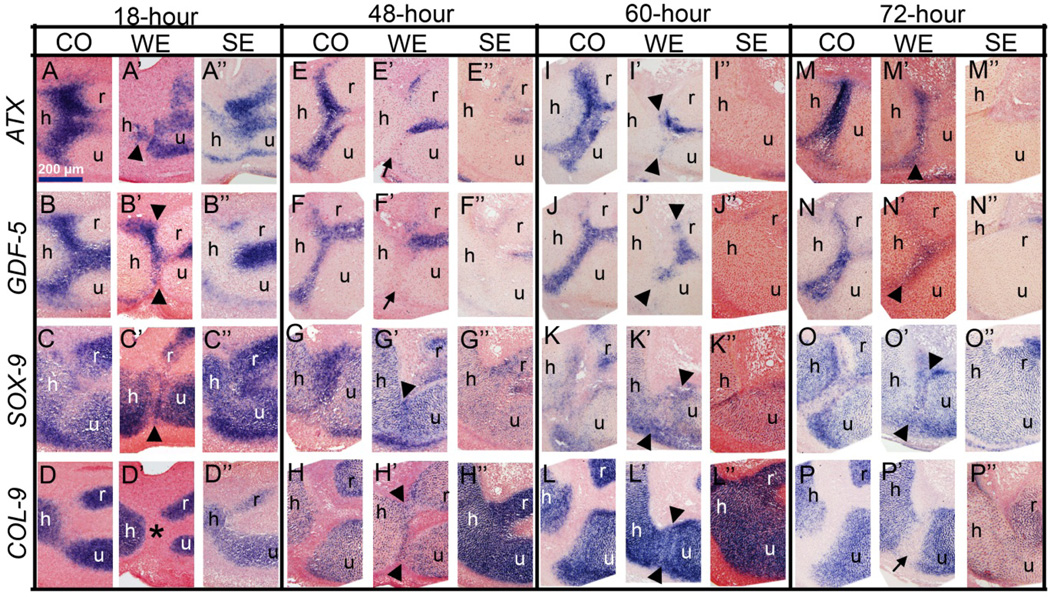
Figure 4.
Gene expression analysis of window excision (WE) and slice excision (SE) limbs at different time points after surgery. 18 hours: A–D”) By this time, in WE the wound is closed and cells that fill in between the skeletal elements appear mesenchymal and express Atx (A’), GDF-5 (B’), Sox-9 (C’) but not Col-9 (asterix in D’). In contrast, SE samples do not display such a mesenchymal cell population and the skeletal elements appear fused (A”, B”, C”, D”). 48 hours: E–H”) At this time point, in WE, cells at the interzone downregulate Atx (E’, arrow) and GDF-5 (F’, arrow) and start expressing Col-9 (H’, arrowheads). SE skeletal elements still look fused (G”, H”) without Atx (E”) and GDF-5 (F”) expression. 60 hours: I–L”) In WE, the appearance of a histologically prominent interzone is accompanied by re-expression of Atx (I’, arrowheads) and GDF-5 (J’, arrowheads). At this stage, Sox-9 (K’, arrowheads) and Col-9 (L’, arrowheads) are still expressed at the regenerating interzone. SE elements still appear fused without joint gene expression (I”, J”, K”, L”) 72 hours: M-P”) In WE, the regenerating joint is even more evident, interzone cells express Atx ( M’, arrowhead), GDF-5 (N’, arrowhead) and Sox-9 (O’, arrowhead) but Col-9 is downregulated (P’, arrow). Compare these expression patterns of the regenerating joint to the control joint in Fig. 4E, F, G, H for similarity. In contrast to WE, SE limbs still lack the expression of joint genes Atx (M”) and GDF-5 (N”). However, consistent with lack of regeneration, fused cartilage cells express Sox-9 (N”) and Col-9 (P”). In all sections, safranin-O was used for the counterstain. For each time point and each marker, a minimum number of five samples were analyzed and a representative sample was used in this figure. Arrowheads indicate gene expression at the interzone and arrows indicate the lack of gene expression. h: humerus, r: radius, u: ulna.

