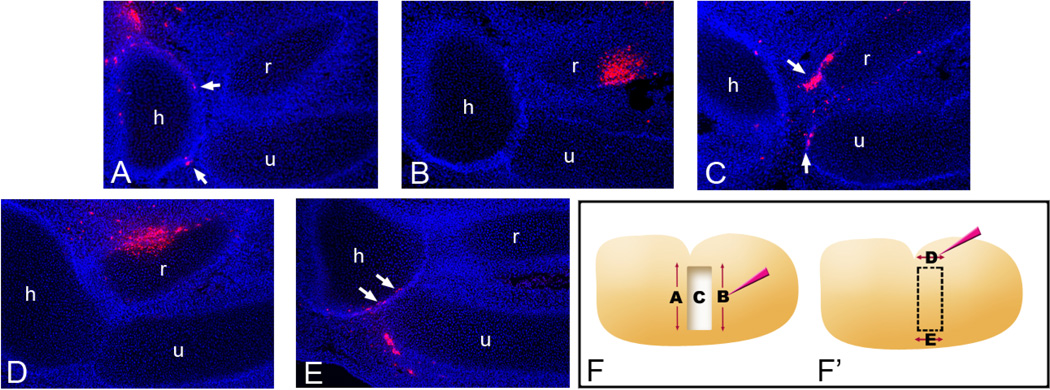
Figure 6.
DiI injections to determine contribution of cell populations to the regenerated joint. (A) DiI injections to the proximal side of the window (A), the distal side of the window (B) and application of DiI to the wound surface (C) were made following window excision. DiI injections to the anterior side of the window (D) and the posterior side of the window (E) were made immediately before window excision. All the experiments are shown schematically in F and F’. (A) DiI injections to the proximal side of the window excision result in a few labeled cells located in the joint interzone with most located near the mid to proximal humerus. (B) Injections to the distal side of the excision show labeled cells in the radius. (C) Application of DiI to the wound surface results in labeled cells in the regenerated joint interzone (arrows). (D) Anterior DiI injections mark a large population of cells near the radius but not in the interzone. (E) Injections to the posterior margin of the window excision results in a number of labeled cells in the regenerated joint interzone (arrows). Each picture is a representative of several injections carried out along the corresponding axis. The blue signal is DAPI. h: humerus, r: radius, u: ulna.

