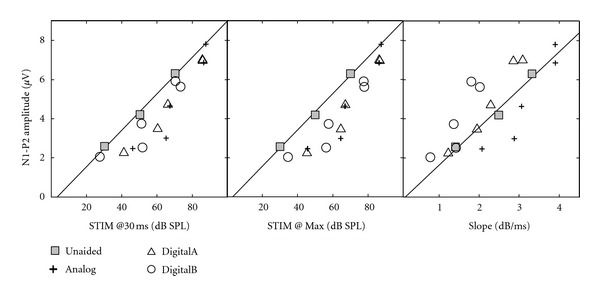
Figure 7.

Group mean SCP amplitude from Marynewich et al. [11] as a function of three acoustic parameters: stimulus level at 30 ms (left panel), maximum stimulus level (middle panel), and onset slope (right panel) for unaided and 3 hearing-aid conditions. The fit line is the linear regression for the unaided condition.
