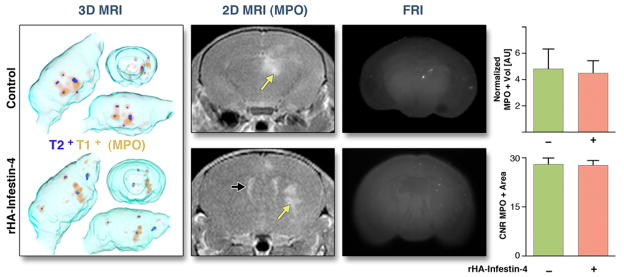
Figure 7. MR imaging of MPO activity on day 3 after thromboemboli-induced SBI.
Assessment of MPO activity 3 days after SBI induced by thromboemboli. Yellow arrows point at MPO+ lesions, black arrows at ventricle. FRI: Fluorescence reflectance imaging, showing location of thromboemboli. MPO+ volume is normalized to T2+ volume. CNR: Contrast-to-noise-ratio. AU: Arbitrary units. Data are presented as mean ± SEM.

