
Fig. 1.
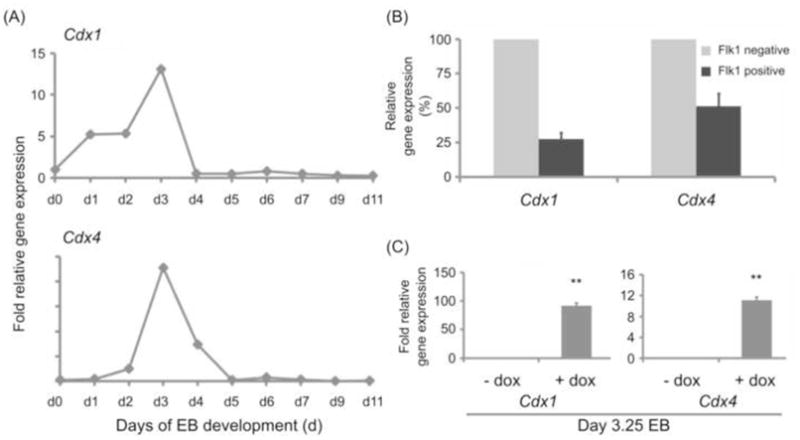
(A) Time course of Cdx1 and Cdx4 expression in differentiating EB show an expression peak around day 3 of EB development. Mouse ESC were differentiated in EB and samples collected between day 1 and day 11 of EB development were subjected to real-time PCR analysis. Results are shown as fold expression relative to expression in undifferentiated ES cells. Shown are data from one representative experiment. (B) Expression of Cdx1 and Cdx4 in Flk1 positive cardioangioblasts isolated at day 4 of EB development. Results are shown as % expression relative to Flk1 negative cells isolated at the same point in time. Shown are data from two biological experiments which showed a purity >90% in the sorted Flk1 positive population. (C) Ectopic Cdx1 and Cdx4 gene induction within the endogenous expression window. iCdx1 and respectively iCdx4 ES cells were differentiated until day 2.25 in basic differentiation medium to allow mesoderm induction and afterwards further cultured in basic differentiation medium +/− doxycycline. Induction of Cdx1 and respectively Cdx4 induction was analyzed by real-time PCR performed 24 hours later on day 3.25 EB. Results are shown as relative fold expression in comparison to non-induced controls collected at the same time-point. Gene expression levels summarize endogenous and if applicable ectopic levels. Shown are summarized results from three experiments.