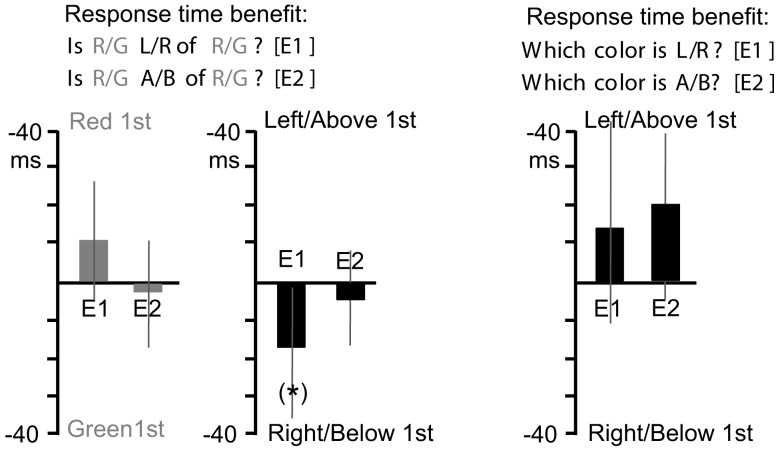
Figure A1.
Response time benefits for Experiments 1 and 2. The first graph (grey bars), depicts response times advantages for the “Is Target Direction of Reference?” question type. Values toward graph top indicate faster responses for trials where the Red object appeared first, and values toward graph bottom indicate faster responses for trials where the Green object appeared first. In the second graph (black bars), values toward graph top indicate faster responses for trials where Left (E1) or Above (E2) object appeared first, and values toward graph bottom indicate faster responses for trials of the opposite cases. The third graph depicts equivalent results for the “Which Color is Direction?” question type. *Indicates a single marginal effect (which would not survive a multiple comparisons correction).

