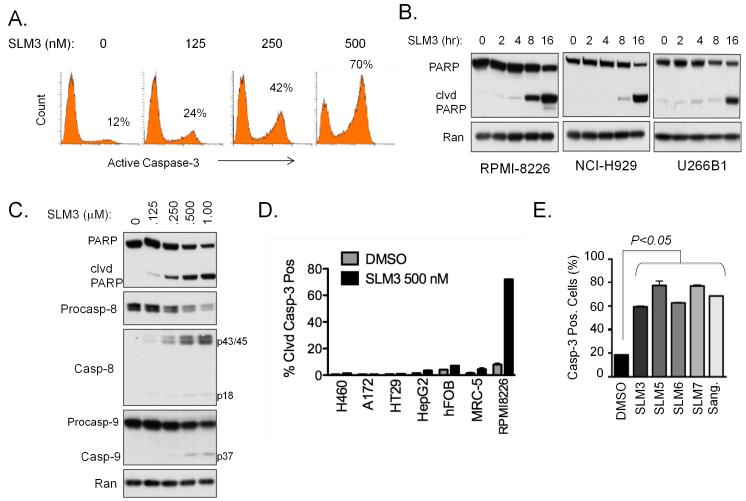
Figure 2. SLM3 selectively induces apoptosis in MM cells.
(A) RPMI-8226 cells were treated with increasing concentrations of SLM3 for 16 hours. Cells were analyzed by flow cytometry for cleaved (active) caspase-3 immunostaining. Representative flow cytometric histograms are shown. The inset percentages indicate the proportion of cleaved caspase-3 positive cells.
(B) RPMI-8226, NCI-H929, and U266B1 cells were treated with 500 nM SLM3 for the indicated time points. Western blots for the caspase-3 substrate PARP are shown. Processing of PARP and the appearance of the cleaved PARP fragment indicates caspase-3 enzymatic activity. Ran blots are included as a loading control.
(C) RPMI-8226 cells were treated with the indicated concentrations of SLM3 for 16 hours. Western blots are shown.
(D) Tumor cells (H460, A172, HT29, HepG2, and RPMI-8226) from multiple tissues of origin and non-malignant cells (hFOB and MRC-5) were treated with 500 nM SLM3 for 16 hours. The percentage of cells that stained positively for active caspase-3 were quantified by flow cytometry. Data represent mean ± S.E (n=3).
(E) RPMI-8226 cells were treated with the indicated SLMs and sangivamycin at concentrations of 500 nM for 16 hours. Cleaved caspase-3 positive cells were quantified using flow cytometry. Data represent mean ± S.E. A student’s t-test was used for statistical analysis.

