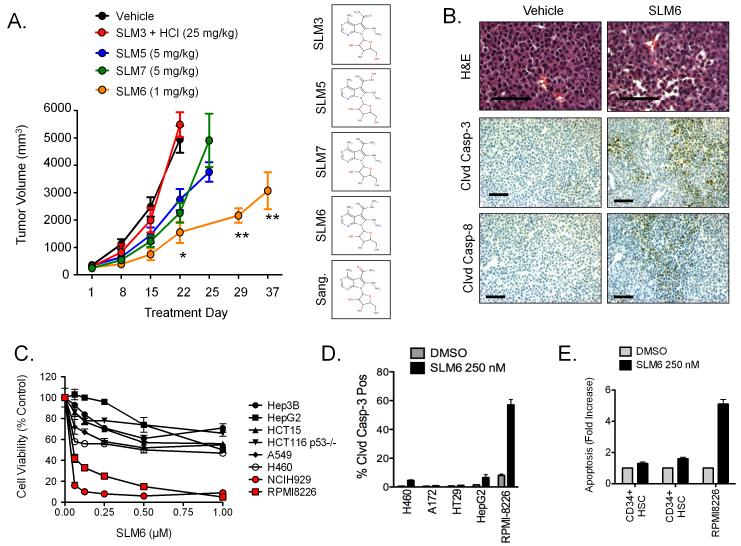
Figure 3. Other SLMs induce death and apoptosis of MM cells with SLM6 demonstrating superior efficacy in vivo.
(A) NCI-H929 subcutaneous xenografted tumors were established in hairless SCID mice. Mice were treated (i.p.) with the indicated doses of SLMs and tumor volume was measured over time by caliper measurement. All SLMs were given once weekly, except for SLM6 which was given only once on day 1. Data points represent mean tumor volume ± S.E. (n=5 mice). Statistical significance was determined using a student’s t-test (*P<0.05 for SLM5, SLM6, and SLM7 compared to vehicle on day 22. **P<0.05 for SLM6 compared to vehicle on day 22). The chemical structures for each of the SLMs are shown at the right.
(B) NCI-H929 xenograft-bearing mice were treated with SLM6 (1 mg/kg; i.p.). After 48 hours, tumors were collected and analyzed by immunohistochemistry for cleaved caspase-3 and cleaved caspase-8. Scale bars equal 100 μm.
(C) Various tumor cell types were treated with increasing concentrations of SLM6 for 24 hours. Cell viability dose response curves are shown. Each data point represents the mean ± S.E (n=3).
(D) The indicated tumor cell lines were treated with SLM6 (250 nM) for 16 hours. Cleaved caspase-3 positive cells were quantified by flow cytometry. Data represent mean ± S.E (n=3).
(E) CD34+ hematopoietic stem cells (HSCs) were isolated from the peripheral blood of healthy donors and treated with 250 nM SLM6 for 24 hours. Apoptosis was measured by FACS analysis of cleaved caspase-3 positive cells. The results obtained from 2 different donors are shown in comparison to RPMI-8226 MM cells. Data represent mean ± S.E. (n=3).

