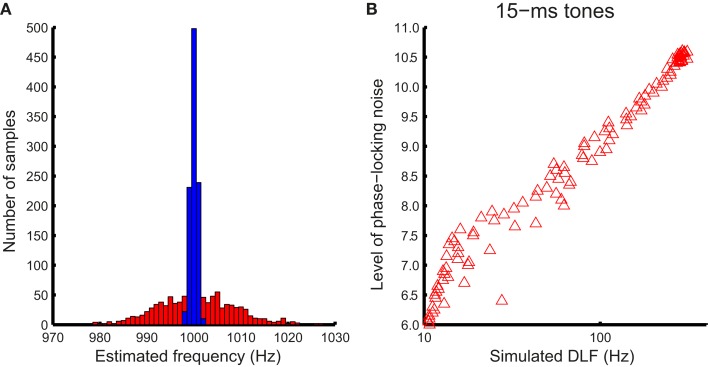
Figure 5.
Simulating the relationship between DLFs and phase locking noise. (A) An example of estimated frequency distribution with phase locking noise. The distribution of estimated frequency for an example noise level (8.8) and the maximum integration window (50 ms) for the 100-ms 1-kHz tone (blue bars), and the entire stimulus for the 15-ms tone (red bars), obtained with 1000 iterations each. (B) The width (standard deviation) of the distribution was used to derive an estimated DLF for each noise level using SDT (in this case for 15-ms tones).

