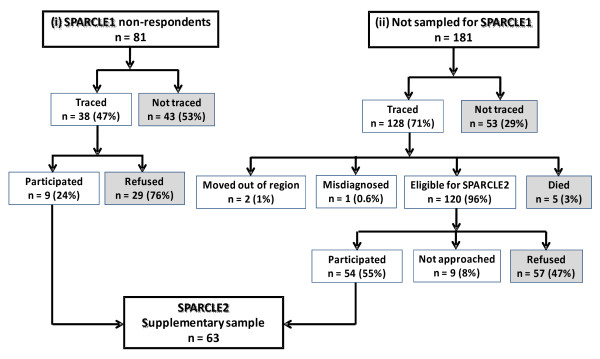
Figure 2.
Pattern of drop-out in supplementary sample. Numbers exclude northwest Germany, which did not have a population-based register of children with CP. The denominator for each percentage is the number of families in the level immediately above. Shaded boxes indicate the categories of non-response that were analysed.

