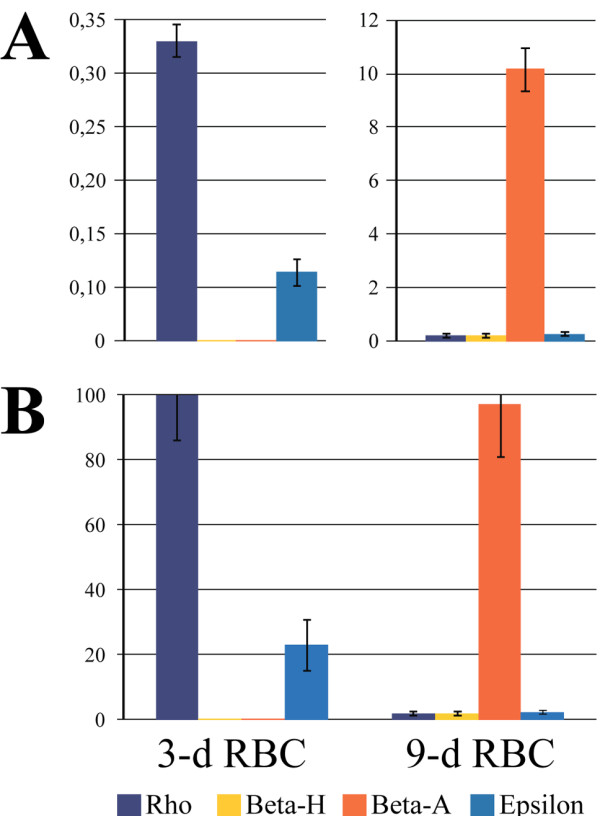
Figure 1.

Analysis of β-globin mRNA levels in chicken 3-day and 9-day embryonic red blood cells. The vertical axis shows the relative amounts of β-globin gene primary transcripts, as determined by RT-qPCR analysis of RNA samples prepared from the blood of 3- and 9-day old chicken embryos. (A) Normalization of data to the level of β-actin mRNA. (B) Normalization of data to the amount of cells used for RNA preparation. The amounts of β-globin gene transcripts detected in different RNA samples were normalized to the number of cells used for preparation of these RNA samples. The amount of the most abundant transcript (ρ-transcript in 3-day RBCs) was set as 100 relative units and the other data were normalized to this value. The error bars represent the S.E.M. for two independent experiments.
