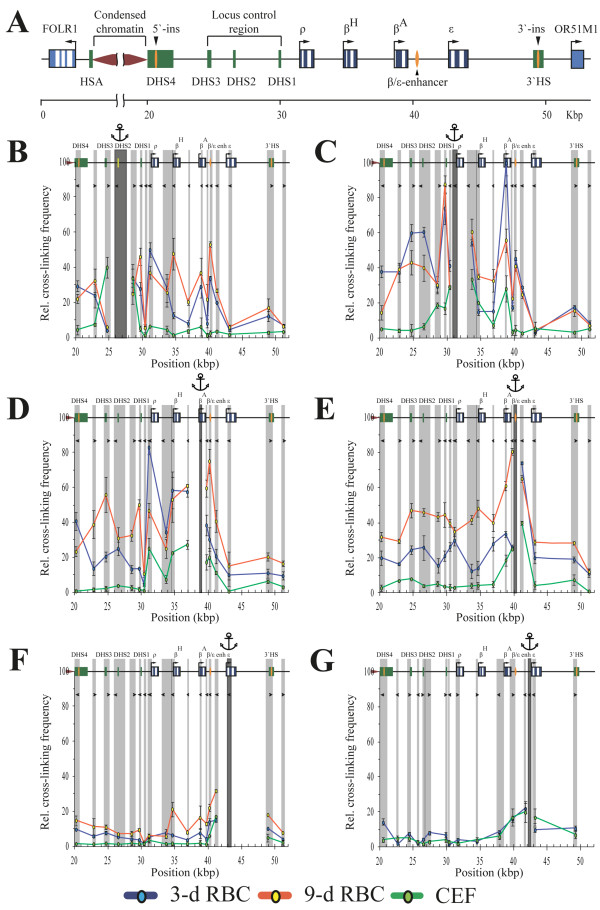
Figure 2.
MboI and NlaIII q3C analysis of the chicken β-globin gene domain. (A) Map showing the positions of genes and known regulatory elements of the chicken β-globin gene domain. The open boxes indicate genes, the blue lines represent exons, and the arrows indicate the direction of transcription. The closed green boxes show HSs. Upstream insulator, downstream enhancer-blocking elements and the β/Ε enhancer are shown by orange ellipses. FOLR1 - gene encoding folate receptor, transcribed in earlier erythroid progenitors; HAS - tissue-specific erythroid DNase I-hypersensitive site; HS1-3 - locus control region (LCR) of β-globin gene domain; OR51M1 - open reading frame for odorant receptor. The map was made using nucleotide sequences NW_001471556 and L17432.1 [GenBank:NW_001471556, GenBank:L17432.1]. (B-G) The relative frequencies of crosslinking of the anchor fragments containing the HS2 (B), ρ-promoter (C), upstream portion of gene βA(D), β/Ε-enhancer (E), upstream portion of gene Ε(F) and Ε-promoter (G). (B-F) show results of MboI 3C analysis and (G) shows the results of NlaIII 3C analysis. The dark grey rectangle in each panel indicates the anchor DNA fragment, and the light grey rectangles indicate the test fragments. The white rectangles indicate the restriction fragments that were not analyzed. The borders between neighboring fragments are indicated by dark grey lines. The tailless arrows represent the primers used for q3C analysis. The positions of test fragments on the restriction map are plotted on the x-axis. The cross-linking frequencies are plotted on the y-axis; the highest cross-linking frequency observed was set as 100 relative units (the cross-linking frequency between the fragment containing the ρ-promoter and the fragment containing the βA gene in 3-day RBCs for MboI 3C analysis, and the cross-linking frequency between the fragment containing HS2 and the fragment containing HS1 in 3-day RBCs for NlaIII 3C analysis (data not shown)). The results of 3C analysis for 3-day RBCs, 9-day RBCs and CEF are shown by the blue, red and green lines, respectively. The error bars represent the S.E.M. for three (B-F) or two (G) independent experiments.

