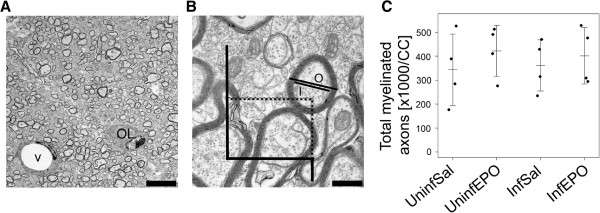
Figure 1.
Assessing myelination in the CC. (A) Uninfected mouse. The lipid-rich myelin sheaths are electron-dense and myelinated axons appear as dark rings, also an oligodendrocyte (OL) and a vessel (V) are common findings. Scale bar corresponds to 5 μm. (B) At higher magnification, unmyelinated axons are seen interspersed between the larger myelinated axons. The counting frame is illustrated. Exclusion lines are in black, inclusion lines are dotted. Only one myelinated axon would be included in this frame; its inner (I) and outer (O) diameter was measured. Scale bar corresponds to 500 nm. (C) The total number of axons profiles at day 8 post infection was the same in all groups as depicted on the strip chart. Each dot represents the total number in one animal. Mean and SD are marked by a horizontal bar and whiskers, respectively.

