
Figure 6.
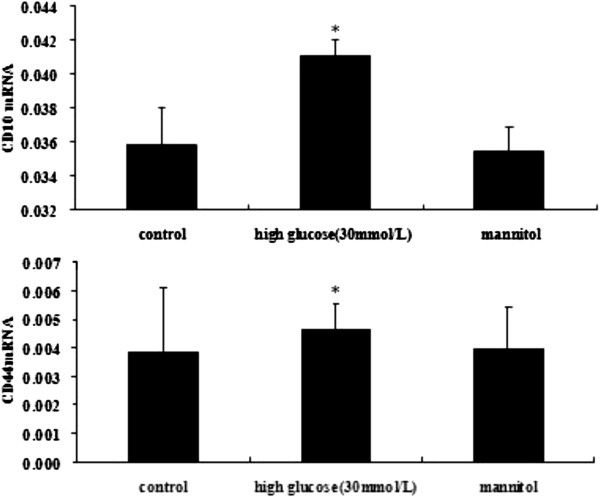
RT-PCR expression of CD10 and CD44 in the NG and HG groups. Notes: HAECs were treated with 30 mmol/L high glucose for the indicated times. The expression of MSCs markers (CD44, CD10) was detected by real-time PCR. The values represent the means ± SD. *, P < 0.05 vs. control.