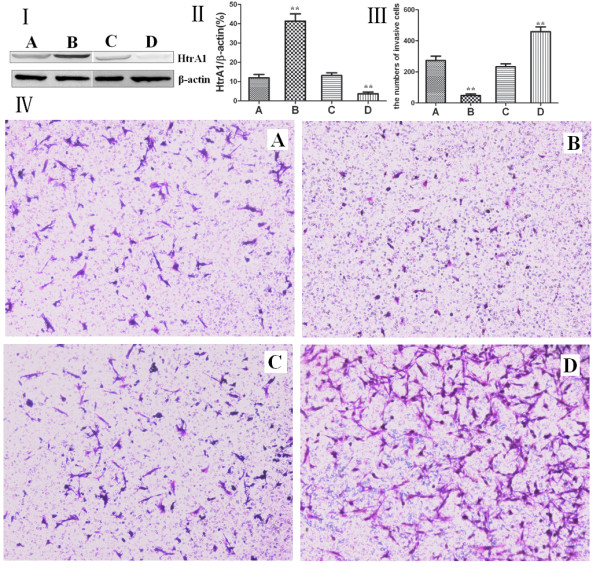
Figure 4.

I: Western blot analysis of HtrA1 protein expression for each group of Eca-109 cells. II: The relative changes of the HtrA1 protein expression levels in each group. III: Measurement of the number of cells crossing the Transwell invasion chamber. IV: Bright field microscopy of each group of Eca-109 cells stained with crystal violet. (A) The untransfected control group; (B) the pcDNA3.1-HtrA1-transfected group; (C) the control siRNA-transfected group; (D) the HtrA1 siRNA-transfected group. **p < 0.01.
