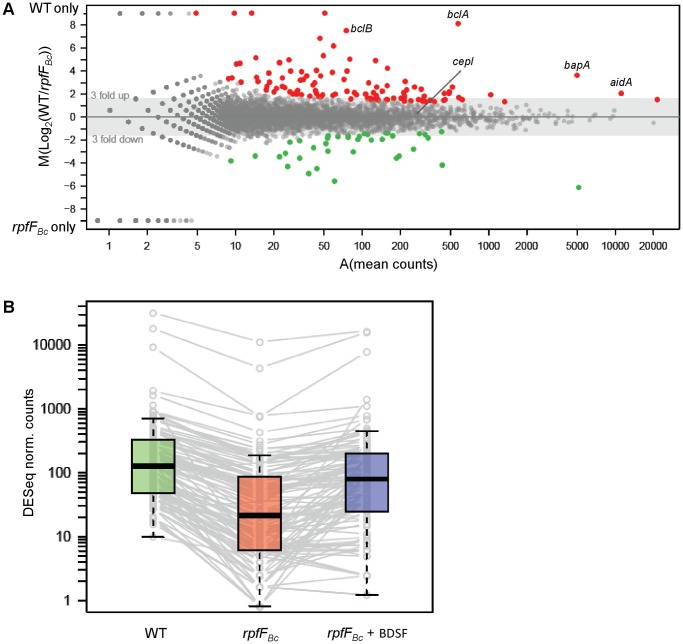
Figure 1. Mapping of the BDSF stimulon.
(A) MA plot showing the fold change in transcript expression of all B. cenocepacia H111 genes versus the mean of identified reads in an rpfF Bc mutant and wild type. The 112 down-regulated transcripts/proteins in the rpfF Bc mutant are indicated in red, the 38 up-regulated genes in green. (B) Box plot demonstrating that supplementing the medium with 10 µM BDSF rescues the gene expression defects in the rpfF Bc mutant.

