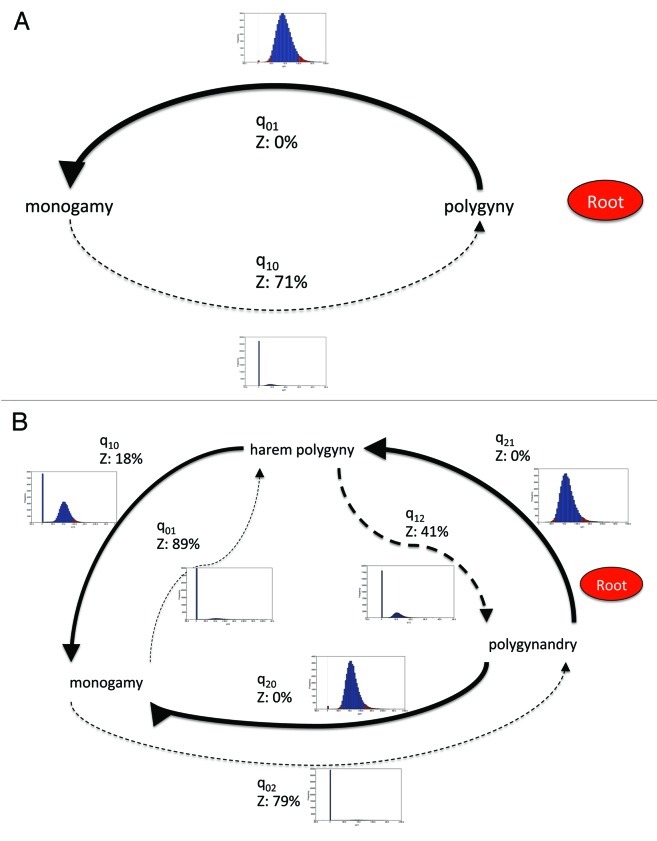
Figure 1. Model of evolution of primate mating systems showing posterior distribution of transition rates between states. A. Monogamy and polygyny. B. Monogamy, harem-polygyny and polygynandry. Thickness of arrows reflects proportion of time the transition rate is not zero. Z denotes a zero transition rate as a proportion of posterior probability distribution. A dashed line denotes a zero transition rate in the RJ derived model. Graphs show posterior probability distribution of each transition rate.

An official website of the United States government
Here's how you know
Official websites use .gov
A
.gov website belongs to an official
government organization in the United States.
Secure .gov websites use HTTPS
A lock (
) or https:// means you've safely
connected to the .gov website. Share sensitive
information only on official, secure websites.
