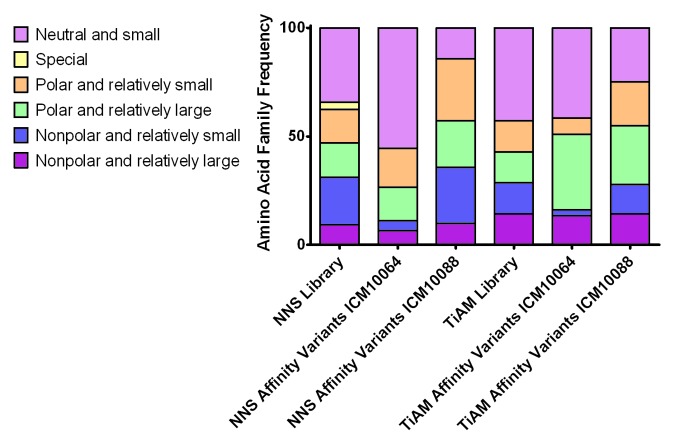
Figure 6. Amino acid frequency in TiAM and NNS libraries before and after selection for improved affinity. The amino acid distribution before library selection was calculated based on the respective library designs and the distribution after affinity selection was calculated from the CDR loop sequences of the affinity matured ICM10064 and ICM10088 variants. Amino acid families are colored according to the key.

An official website of the United States government
Here's how you know
Official websites use .gov
A
.gov website belongs to an official
government organization in the United States.
Secure .gov websites use HTTPS
A lock (
) or https:// means you've safely
connected to the .gov website. Share sensitive
information only on official, secure websites.
