
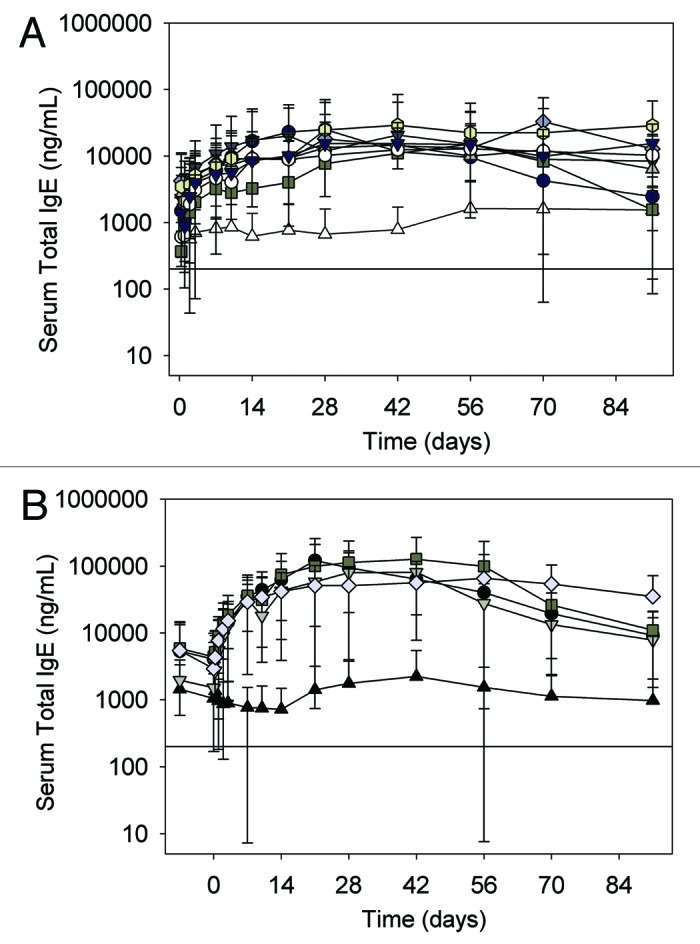
Figure 3. (A) Serum total IgE concentration-time profiles following a single subcutaneous administration of HAE1 to juvenile cynomolgus monkeys. Data represent the mean ± SD of n = 6 animals/group. Open triangle, control; Closed circle, HAE1 7.5 mg/kg; closed dark gray triangle, 15 mg/kg; closed square, 30 mg/kg; closed diamond, 50 mg/kg; closed light gray triangle, 75 mg/kg; closed octagon, 100 mg/kg; open circle, 200 mg/kg; closed black triangle, 250 mg/kg. Black solid line represents the limit of quantitation (LOQ) in the Total igE ELISA (< 200 ng/mL). (B) Serum total IgE concentration-time profiles following a single subcutaneous administration of HAE2 to juvenile cynomolgus monkeys. Data represent the mean ± SD of n = 6 animals/group. Closed triangle, control; Closed circle, HAE2 30 mg/kg; closed triangle, 50 mg/kg; closed square, 100 mg/kg; closed diamond, 250 mg/kg. Black solid line represents the limit of quantitation (LOQ) in the Total igE ELISA (< 200 ng/mL).