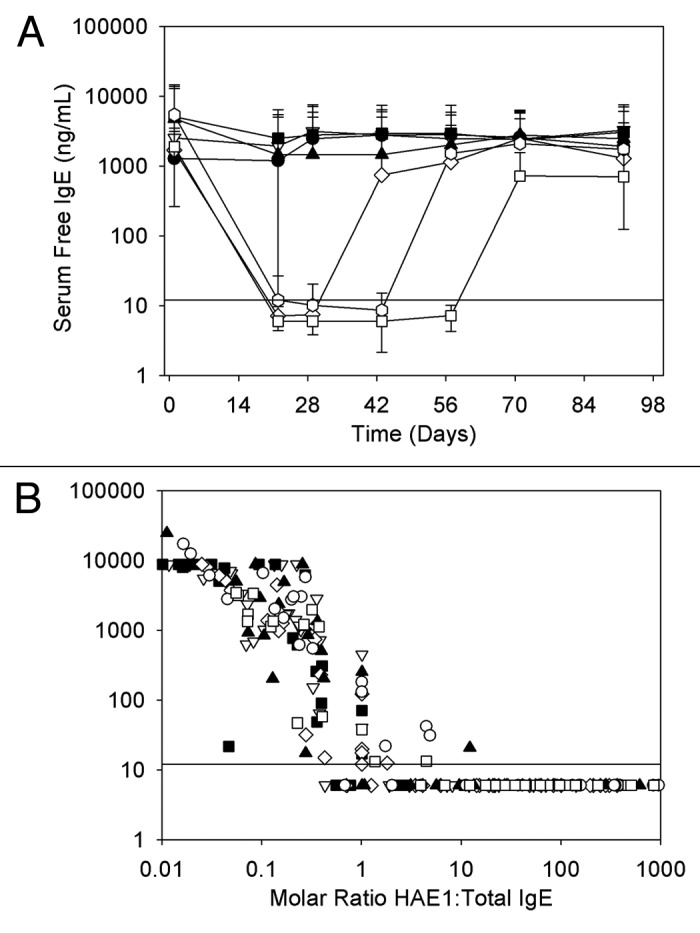
Figure 4. (A) Serum free IgE concentration-time profiles following a single subcutaneous administration of HAE1 to juvenile cynomolgus monkeys. Data represent the mean (± SD) of n = 6 animals/group (closed circle, placebo; open triangle, 7.5 mg/kg; closed square, 15 mg/kg; open diamond, 30 mg/kg; closed triangle, 50 mg/kg; open circle, 100 mg/kg; open square, 250 mg/kg; solid line represents the limit of quantitation (LOQ) in the free IgE ELISA (< 12 ng/mL). To illustrate the extent of reduction in free IgE levels during the course of treatment, LOQ samples were assigned a value of 6 ng/mL. This value was used in determining the mean free IgE concentration shown here. (B) The relationship of serum free IgE to the molar ratio of serum HAE1 to total IgE following a single subcutaneous administration of HAE1 to juvenile cynomolgus monkeys. Data points represent results from individual animals (closed circle, placebo; open triangle, 7.5 mg/kg; closed square, 15 mg/kg; open diamond, 30 mg/kg; closed triangle, 50 mg/kg; open circle, 100 mg/kg; open square, 250 mg/kg; solid line represents the limit of quantitation (LOQ) in the free IgE ELISA (< 12 ng/mL). To illustrate the extent of reduction in free IgE levels during the course of treatment, LOQ samples were assigned a value of 6 ng/mL.
