Figure 5.

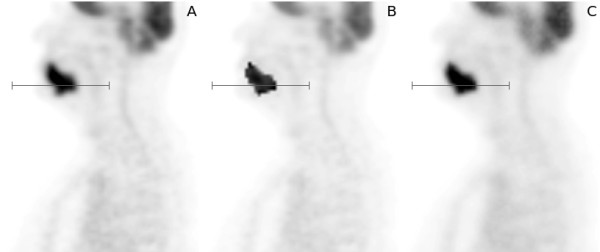
Illustration of the simulation procedure. A: original data. B: simulated data before smoothing. C: simulated data after smoothing. The grey line segment indicates position of the line profiles shown in Figure 4.

Illustration of the simulation procedure. A: original data. B: simulated data before smoothing. C: simulated data after smoothing. The grey line segment indicates position of the line profiles shown in Figure 4.