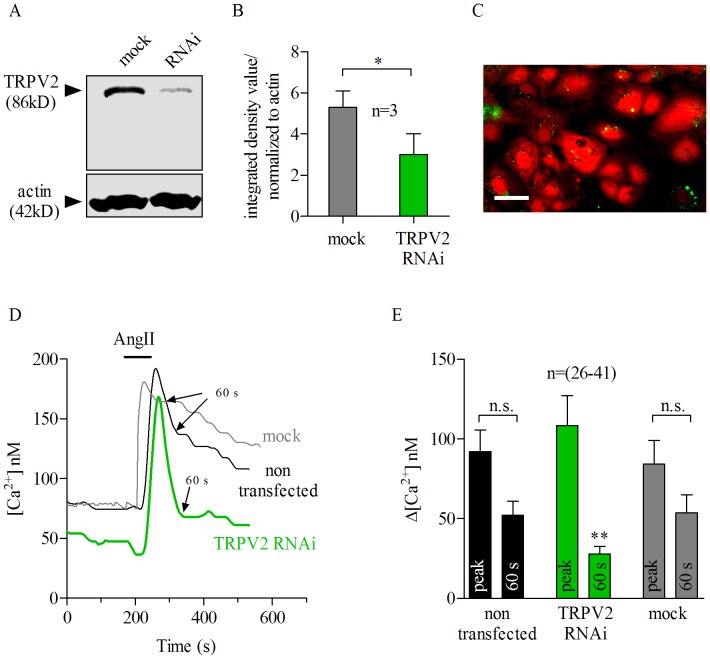
Figure 5. AngII-evoked Ca2+ response is mediated by TRPV2-dependent Ca2+ influx in porcine RPE cells.
A: Western blot analysis indicated successful suppression of TRPV2 channel by RNAi. Transfection with mock RNA served as control. B: Densitometry analysis of each lane in the western blot shown in A. TRPV2- RNAi treated cells (green) showed a down-regulation of TRPV2 protein in about 55% compared to mock transfected cells (gray). TRPV2 bands in each group (mock and RNAi) were normalized to actin. Bars represent means ± SEM; * p<0.05, paired t test. Densitometry analysis results from 3 different blots; n = 3. C: Representative Fura 2-AM loaded cells (in red) and cells transfected with either TRPV2-RNAi or mock RNA- bound to Alexa 488 fluorescent dye (green dots) (see methods). Scale bar, 30 µm. D: TRPV2-RNAi treated cells (green trace) showed a quick reduction (within 60 s, arrow) of AngII-evoked Ca2+(bar) elevation when compared to non-transfected (black trace) or mock-transfected cells (gray trace). Application of AngII at 100 nM for 80 seconds (bar) evokes similar Ca2+responses in mock (gray trace) or non-transfected (black trace) porcine RPE cells. Transfection with mock RNA (gray trace) did not alter the sustained AngII-evoked Ca2+elevation (delayed recovery phase) as TRPV2-RNAi did. Sixty seconds after the maximum AngII-elicited calcium response is shown by arrows. E: Summary of data from experiments shown in D. Black (for non-transfected cells), green (for TRPV2-RNAi) and gray (for mock) transfected cells. Bars represent means ± SEM of the difference between AngII-evoked Ca2+signal at the peak and 60 seconds after the peak respectively. (**) p<0.001; repeated measures ANOVA. n.s = not significant. n = number of cells from 26–41 (E) independent experiments. A: Application of AngII (100 nM) for 80 seconds (bars) caused transient Ca2+response in pRPE cells. Bath application of 100 nM AngII (bars) produced a Ca2+response that was not abolished by co-application of 10 µM U73343 (gray shadow), the inactive analog of the phospholipase C (PLC) blocker U73122. B: summary of data from experiments shown in A. Bars in Fig. 2B represent means ± SEM for AngII-evoked Ca2+responses before (open bars) during the peak (black bars) and at 60 s after the maximum AngII-elicited calcium response (gray bars). (*; #) p<0.05, ** p<0.0001; repeated measures ANOVA. n = number of cells from 9 independent experiments.

