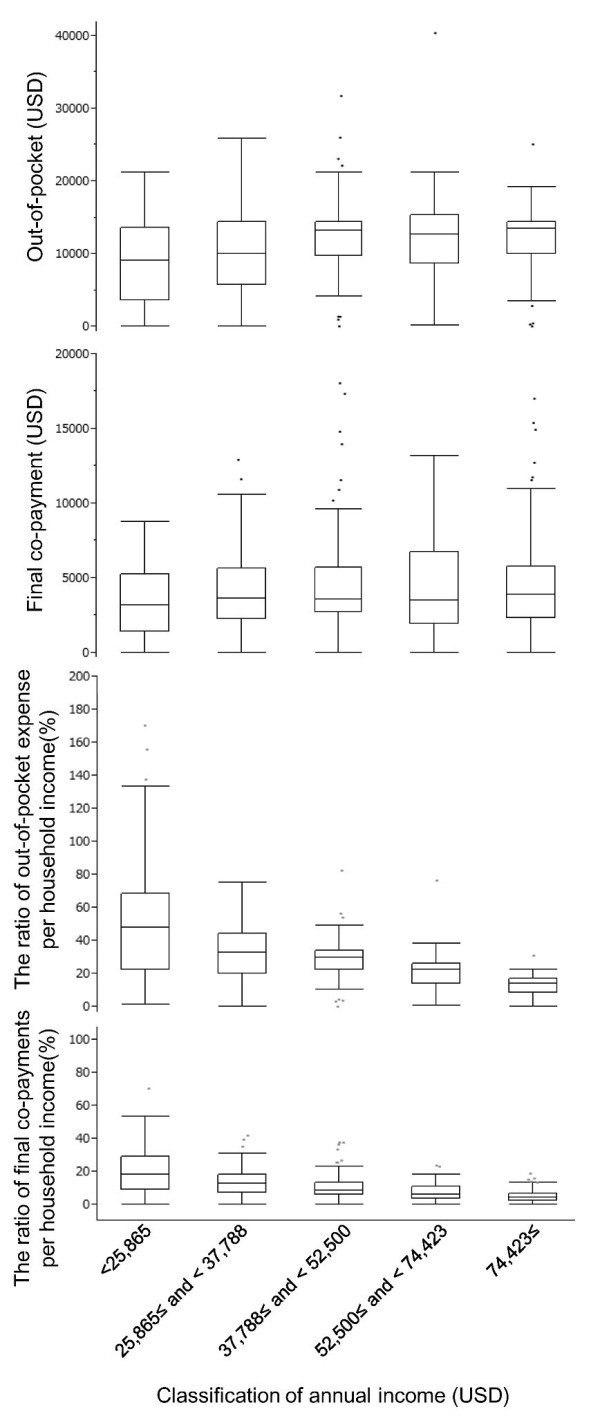
Figure 3.

Medical expenses in 2008 by quintile groups of annual income. The classification of annual income on the X axis is based on the 2008 annual report of family income and expenditure in Japan. The currency was calculated based on the average exchange rate in 2008:1 USD = 104 Yen. The box plots represent the median, 25th and 75th percentiles (the box) as well as the range without outliers (the whiskers). The number of valid answers for each income group was 93, 96, 79, 41 and 59 across smaller to larger X axis categories.
