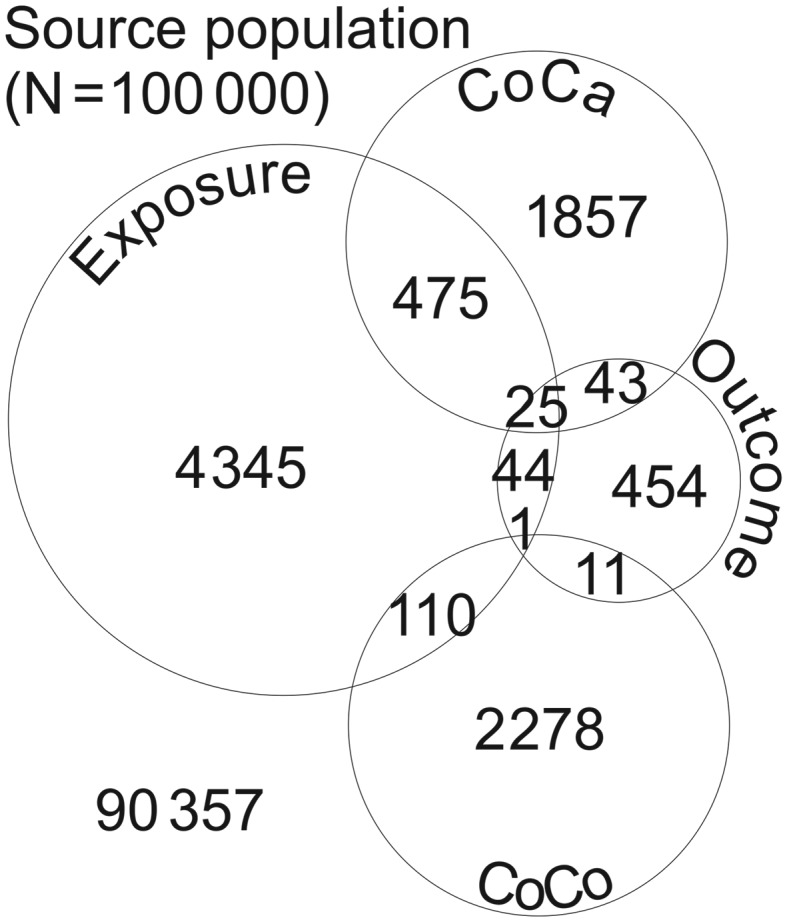
Figure 1.

Venn diagram showing the distribution of 2400 cases and 2400 controls in relation to an exposure and an outcome in a population of 100 000 individuals. The numbers were generated using functions found in the Supplementary Appendix. Abbreviations: CoCa, cohort of cases; CoCo, cohort of controls.
