Figure 1.
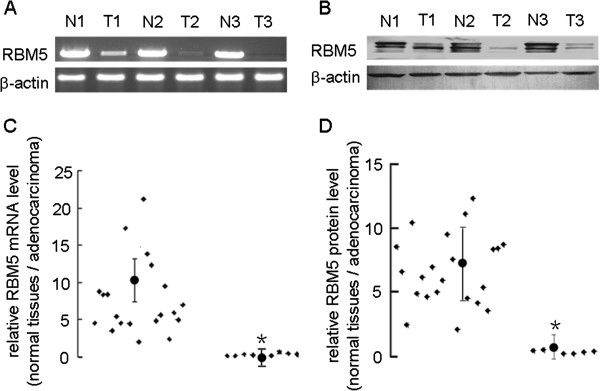
Expression of RBM5 in human lung cancer tissues.(A) Agarose gel of semi-quantitative RT-PCR data of RBM5 mRNA expression in representative samples from tumor and non-tumor specimens. Total RNA was isolated and subjected to semi-quantitative RT-PCR and quantified using Quantity One software. (B) Western blot of RBM5 protein expression in representative samples from tumor and non-tumor specimens. Total cellular protein was extracted, subjected to Western blot analysis and quantified using Quantity One software. (C) The ratio of RBM5 mRNA expression level in normal lung tissues (N) to that in lung adenocarcinoma tissues (T). *χ2 = 2.814, p < 0.05 indicates significant difference as compared to the groups whose ratio > 1. (D) The ratio of RBM5 protein expression level in non-tumor tissue (N) to that in lung adenocarcinoma tissues (T) from 30 patients with lung adenocarcinoma. *χ2 = 2.963, p < 0.05 indicates significant difference as compared to the groups whose ratio > 1.

