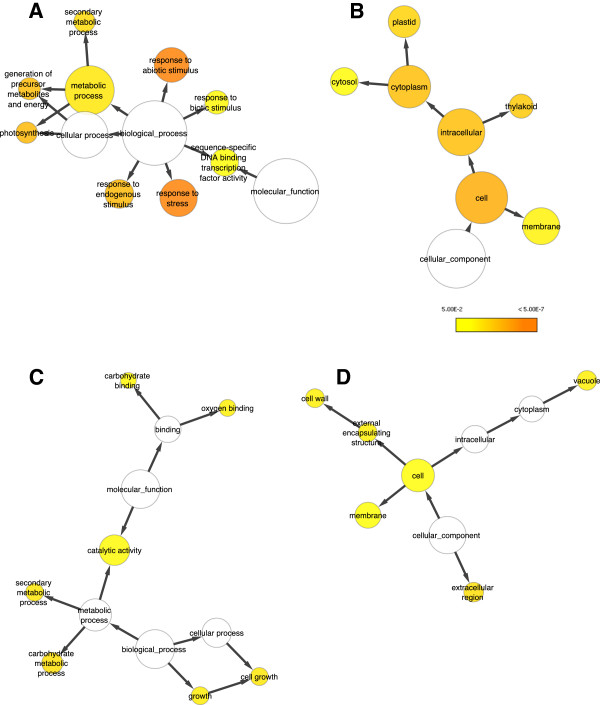
Figure 2.
Overrepresented functions and processes in 240 differentially expressed genes during ACC-induced inhibition of root cell elongation. Gene Ontology (GO) categories that were statistically overrepresented (hypergeometric test, multiple testing correction - Benjamini & Hochberg False Discovery Rate (FDR) correction significance level 0.05) in the set of genes were represented as circles, their size relating to the number of associated genes, with p-values indicated by heat map colour. Linking arrows indicate GO subcategories within parent categories. Created in Cytoscape using the BiNGO plugin. (A,B) up regulated genes, (C,D) down regulated genes.

