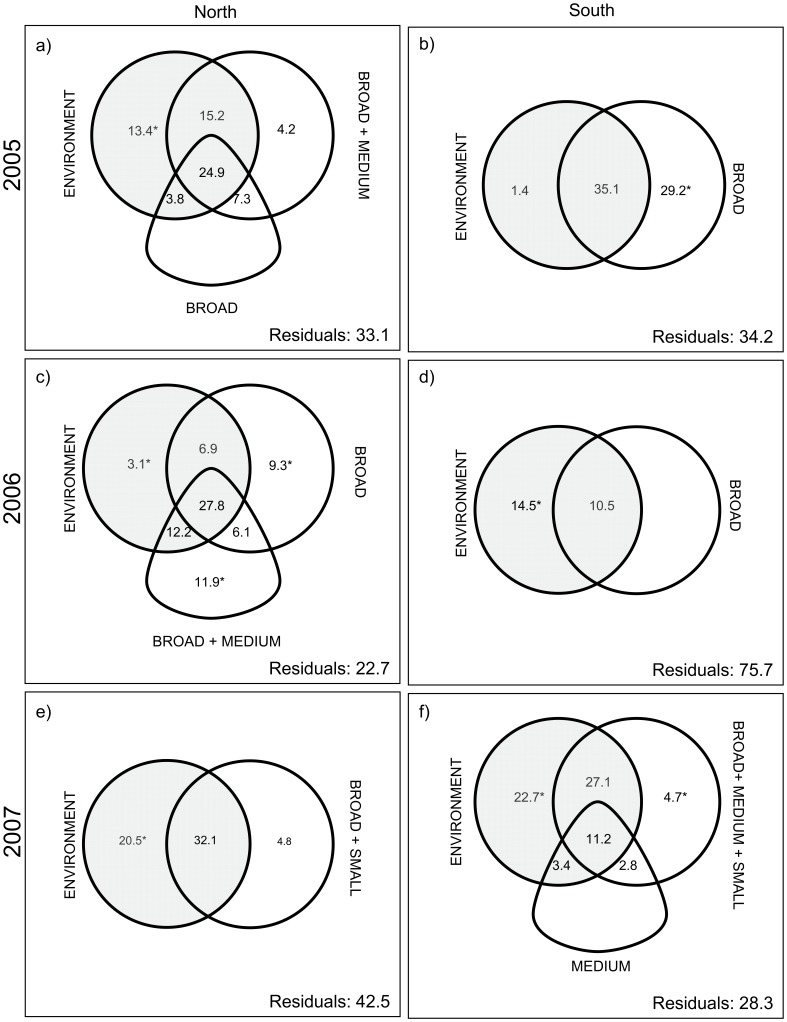
Figure 2. Relative importance of environmental and spatial variables.
Venn diagrams illustrating the results of variation partitioning on the log-transformed abundance of yellow perch larvae per square meter in the three study years among environmental and spatial variables. The variation explained by environmental and non-directional spatial variables (i.e. MEM and TREND) is represented by circles (grey and open, respectively), whereas plectrum-shaped objects represent the variation explained by directional spatial variables (AEM). Percentage of unexplained variation is given at the bottom right of each panel (Residuals). The sizes of the objects are not proportional to their importance in terms of explained variation.

