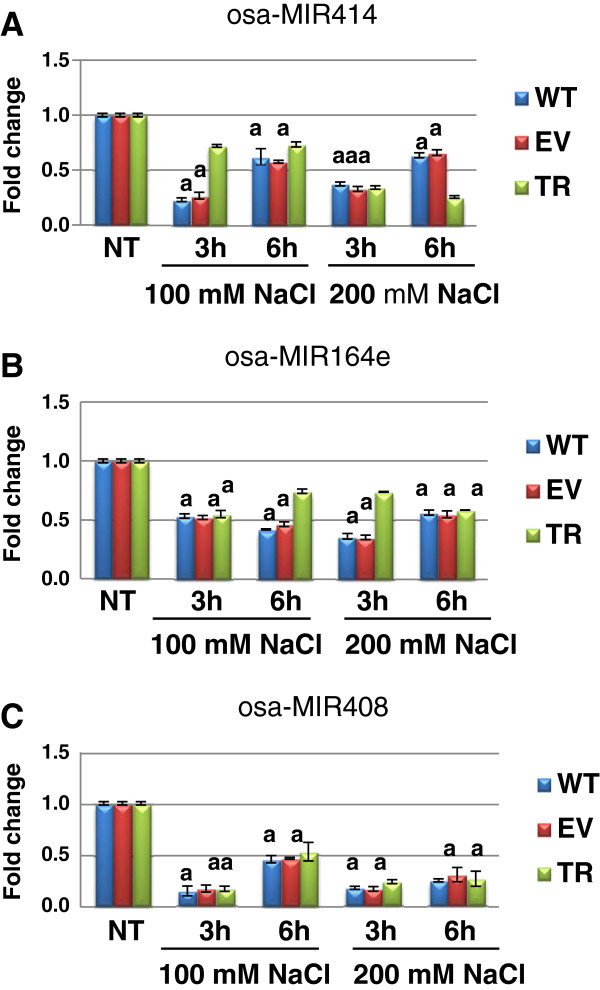
Figure 4.
Expression levels of osa-MIR414 (A), osa-MIR164e (B) and osa-MIR408 (C) in wild type (WT), empty vector control (EV) and transgenic rice plants ectopically expressing PDH45 gene (TR), grown in greenhouse and challenged with 100 and 200 mM NaCl for 3 and 6 h, respectivelly. The relative expression is presented as fold change to control. Values are expressed as means ± SD of three independent replicated plants; Tuckey test p > 0.05 between treatments; a, no statistical differences between the samples inside each treatment; NT, non-treated control.

