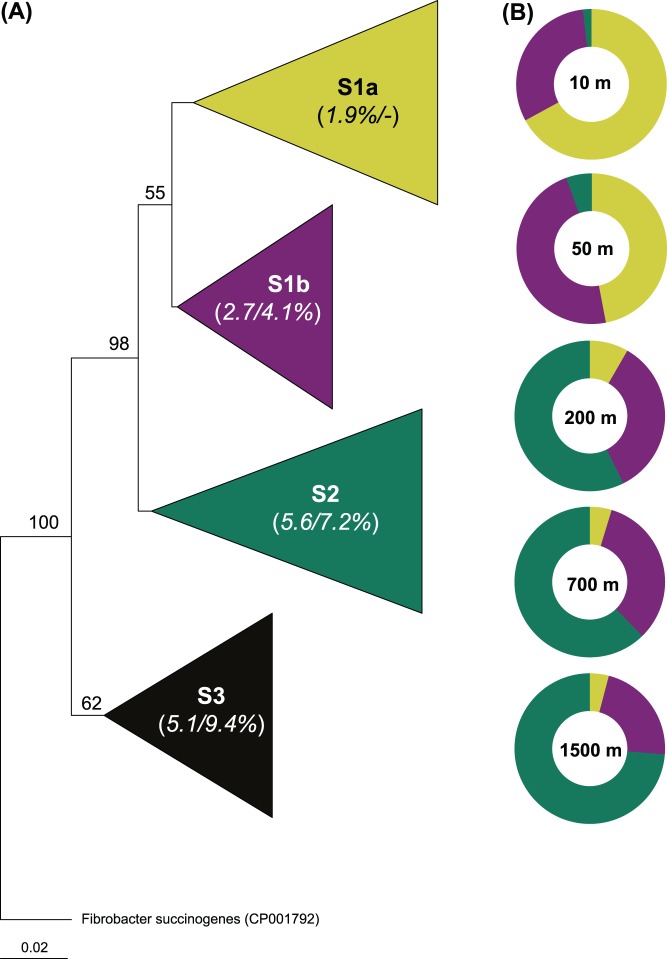
Figure 1. 16S rRNA gene-based phylogenetic tree of subgroups and their relative abundances in the Red Sea’s water column.
(A) Phylogram showing collapsed nodes (subgroups) that produced significant bootstraps with both neighbor-joining and maximum parsimony approaches in trees generated using PAUP. Numbers in bracket denote intra−/intergenetic divergence within each subgroup; the latter was calculated by comparing the rest with S1a. A detailed phylogenetic tree is provided as Figure S4. (B) Shows the shift in the relative abundances of each subgroup at different depths of the Red Sea’s water column.

