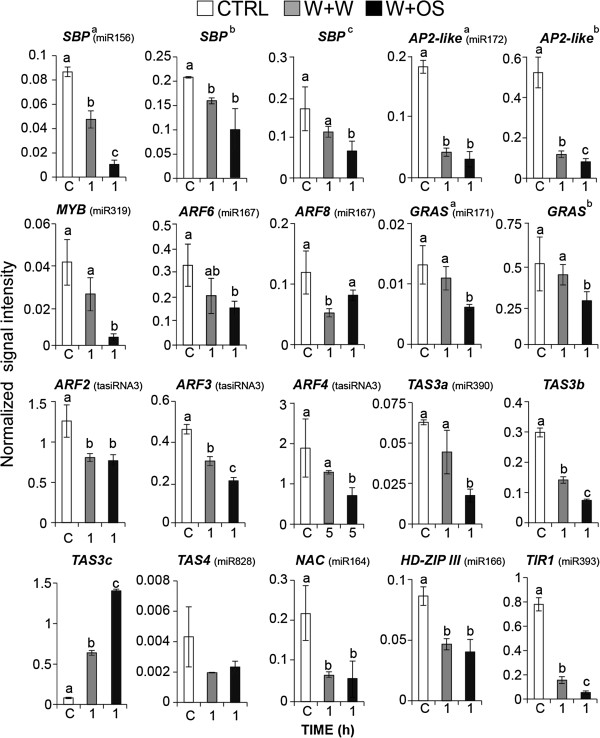
Figure 4.
Target genes expression of miRNAs and tasiRNAs. Mean (± SE) levels of normalized transcript abundance of miRNAs and tasiRNAs target genes after W+W and W+OS treatments. Untreated plants served as control (CTRL, C). Signal intensities in microarray data was normalized using the 75th percentile value and log2-transformation. Letters indicate significant differences (P < 0.05) in Fisher’s PLSD test following an ANOVA. For identification of the target genes, see Additional file 9.

